The Key Metrics Dashboard provides an overview of key information from the Profiling Reports, Performance Reports and Exception Reports.
It shows trade lanes with the highest numbers of exceptions and failures, and graphs of both delivery lead times and despatch volumes. For example, you can use the report to:
Look at which carrier services have unacceptably high percentages of exceptions/failures, or unacceptably long lead times.
Highlight to eCommerce Analysts the trade lanes where volumes are starting to fall.
The report uses the last 50 days of transactional data but there is no built-in drill through capability.
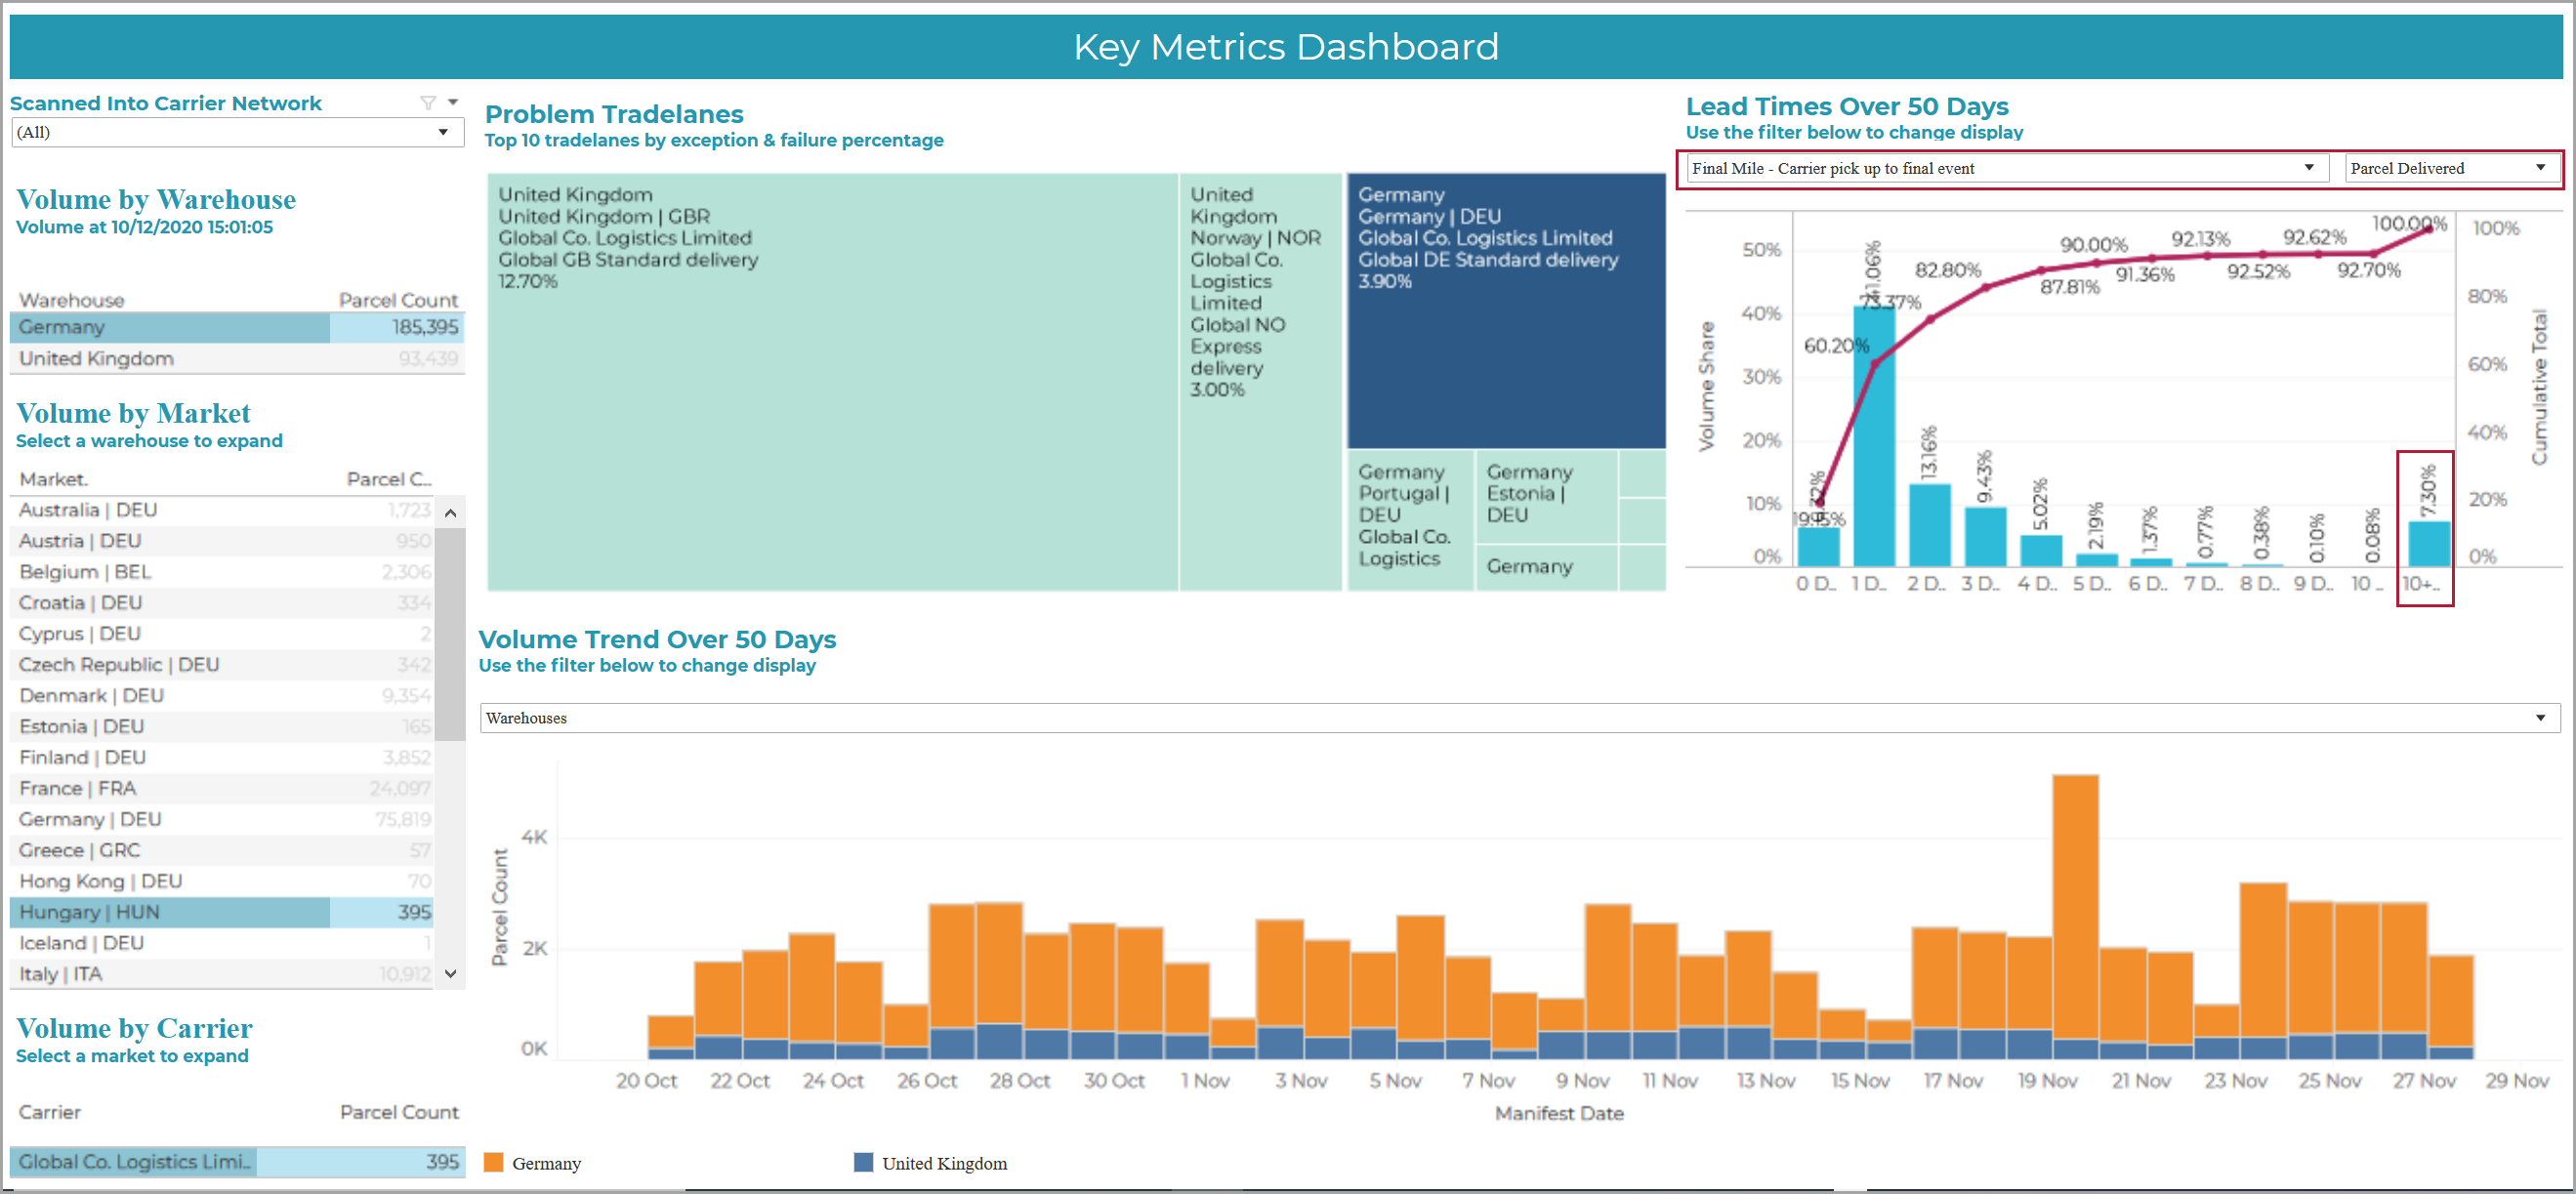
The Lead Times graph on the top right of the dashboard shows that, for a selected trade lane, an unacceptably high percentage of parcels are taking over 10 days to be delivered during the 'final mile'.
To see these results, you select the following Lead Time filters on the top right: Final Mile as the transit time and Parcel Delivered as the final event:

You can now investigate further using the Lead Time Statistics report, which allows you to drill down to the parcels so that you can see why the final mile delays might be happening.
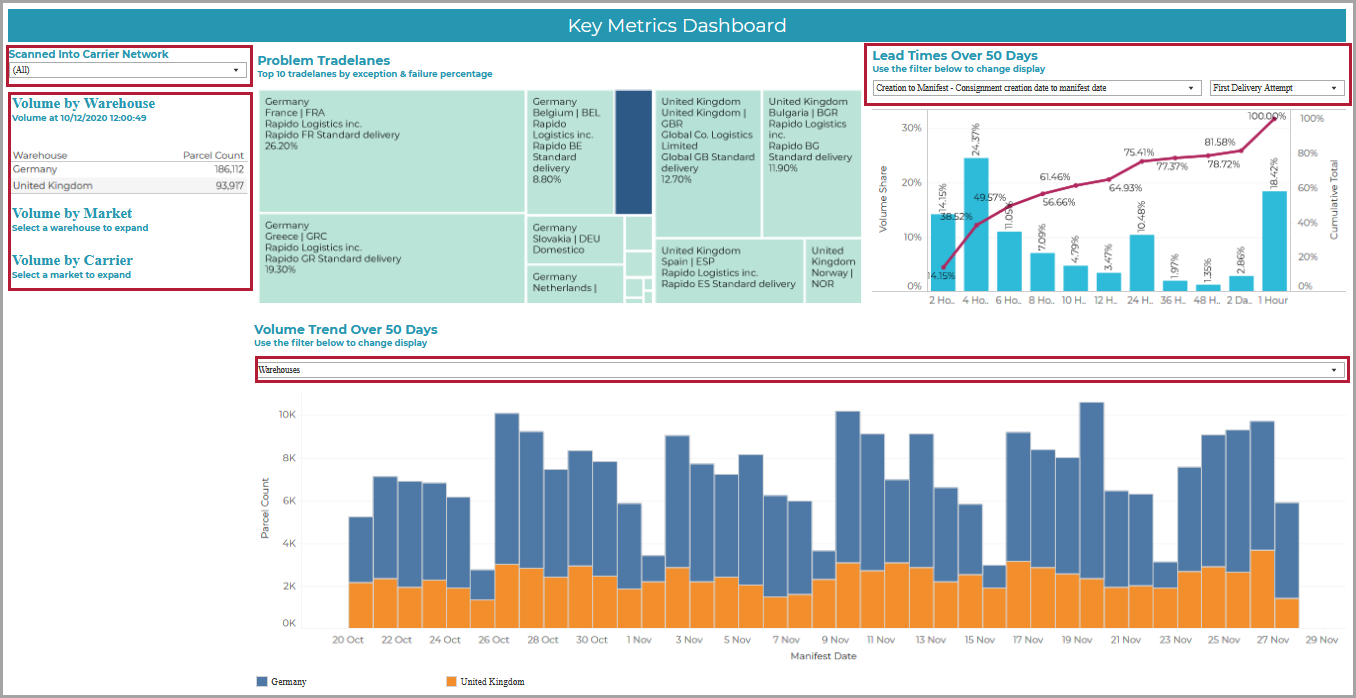
The report allows you to slice the data using the filters and switches highlighted in the following screenshot:

Scanned into Carrier Network?
This filter allows you to determine whether or not to include data for 'non-scanned' parcels (i.e. parcels that were not tracked and those for which labels were printed but which were never shipped):

This flag has been implemented as a Boolean indicator. You can select Yes to filter out 'non-scanned' parcels, No to show data for just the non-scanned parcels, or All (the default) to find all parcels (regardless of whether or not they have been scanned into the carrier network).
Note on filtering by Trade Lane
You can reduce the default dataset by selecting individual trade lanes on the left of the report.
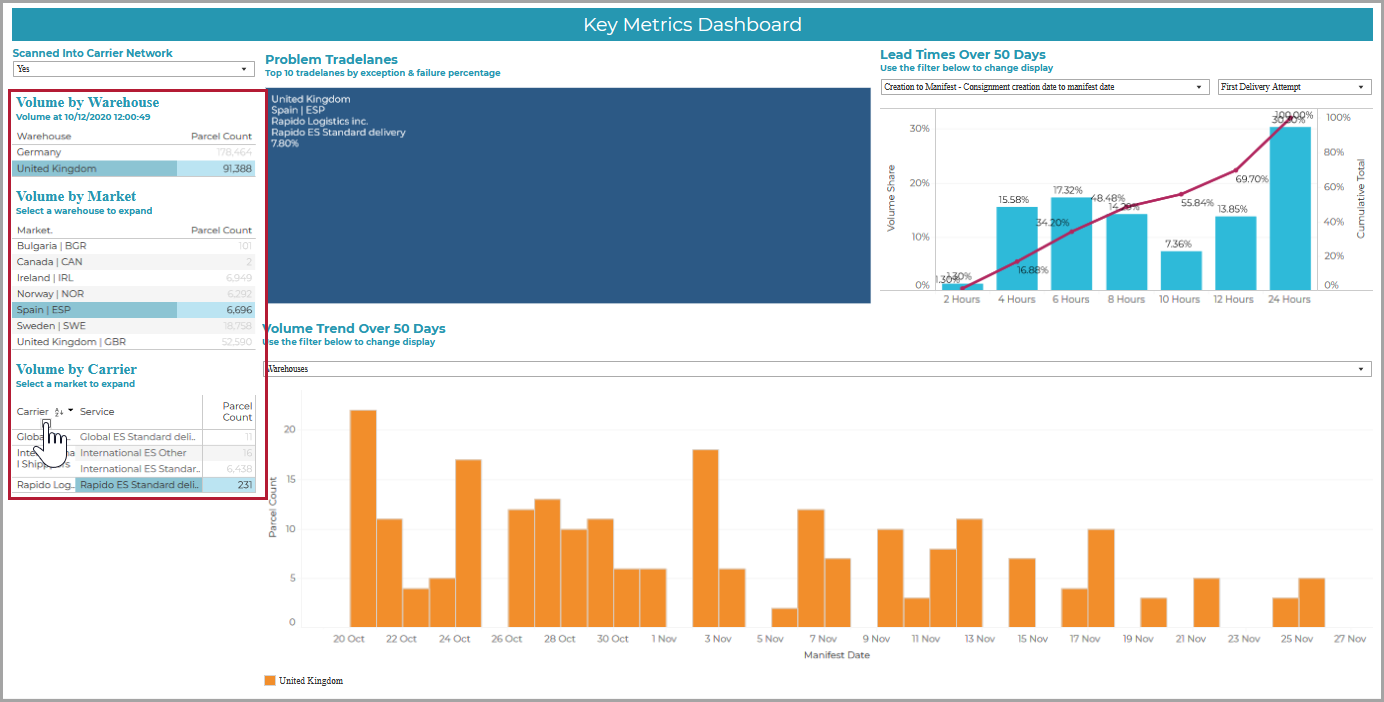
You first select a warehouse on the left of the report, and then, if required, a market, followed by a carrier.
After expanding the carriers using the cursor over the + symbol, you can select a carrier service:

Tip
If you are interested in the selected carrier service to the exclusion of everything else, use the Keep Only switch:

In the top right of the dashboard, you can select the type of Transit Time and the Final Event that determines whether the criterion for completion of a event is the First Delivery Attempt or Parcel Delivered:

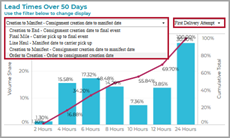
The Transit Time switch allows you to specify how the transit event is to be defined for the current dataset:

The events are self-explanatory. The time bands for the top two events are days, whereas those for the bottom three events are hours.
Creation to Manifest is the default Transit Time.
Where Final Event is specified in a Transit Time selection, this switch allows you to determine whether the Final Event is the First Delivery Attempt (the default), or the Actual Delivery into the consumer's hands:

Choose the part of the selected trade lane for which the volume trend at the bottom of the report is to be shown (the Warehouses, Markets, Carriers or Services):
