The Scan Latency Analysis report gives you an overall view of how fresh your data is, showing you the time lag between carrier scans and the appearance of those scans in your system.
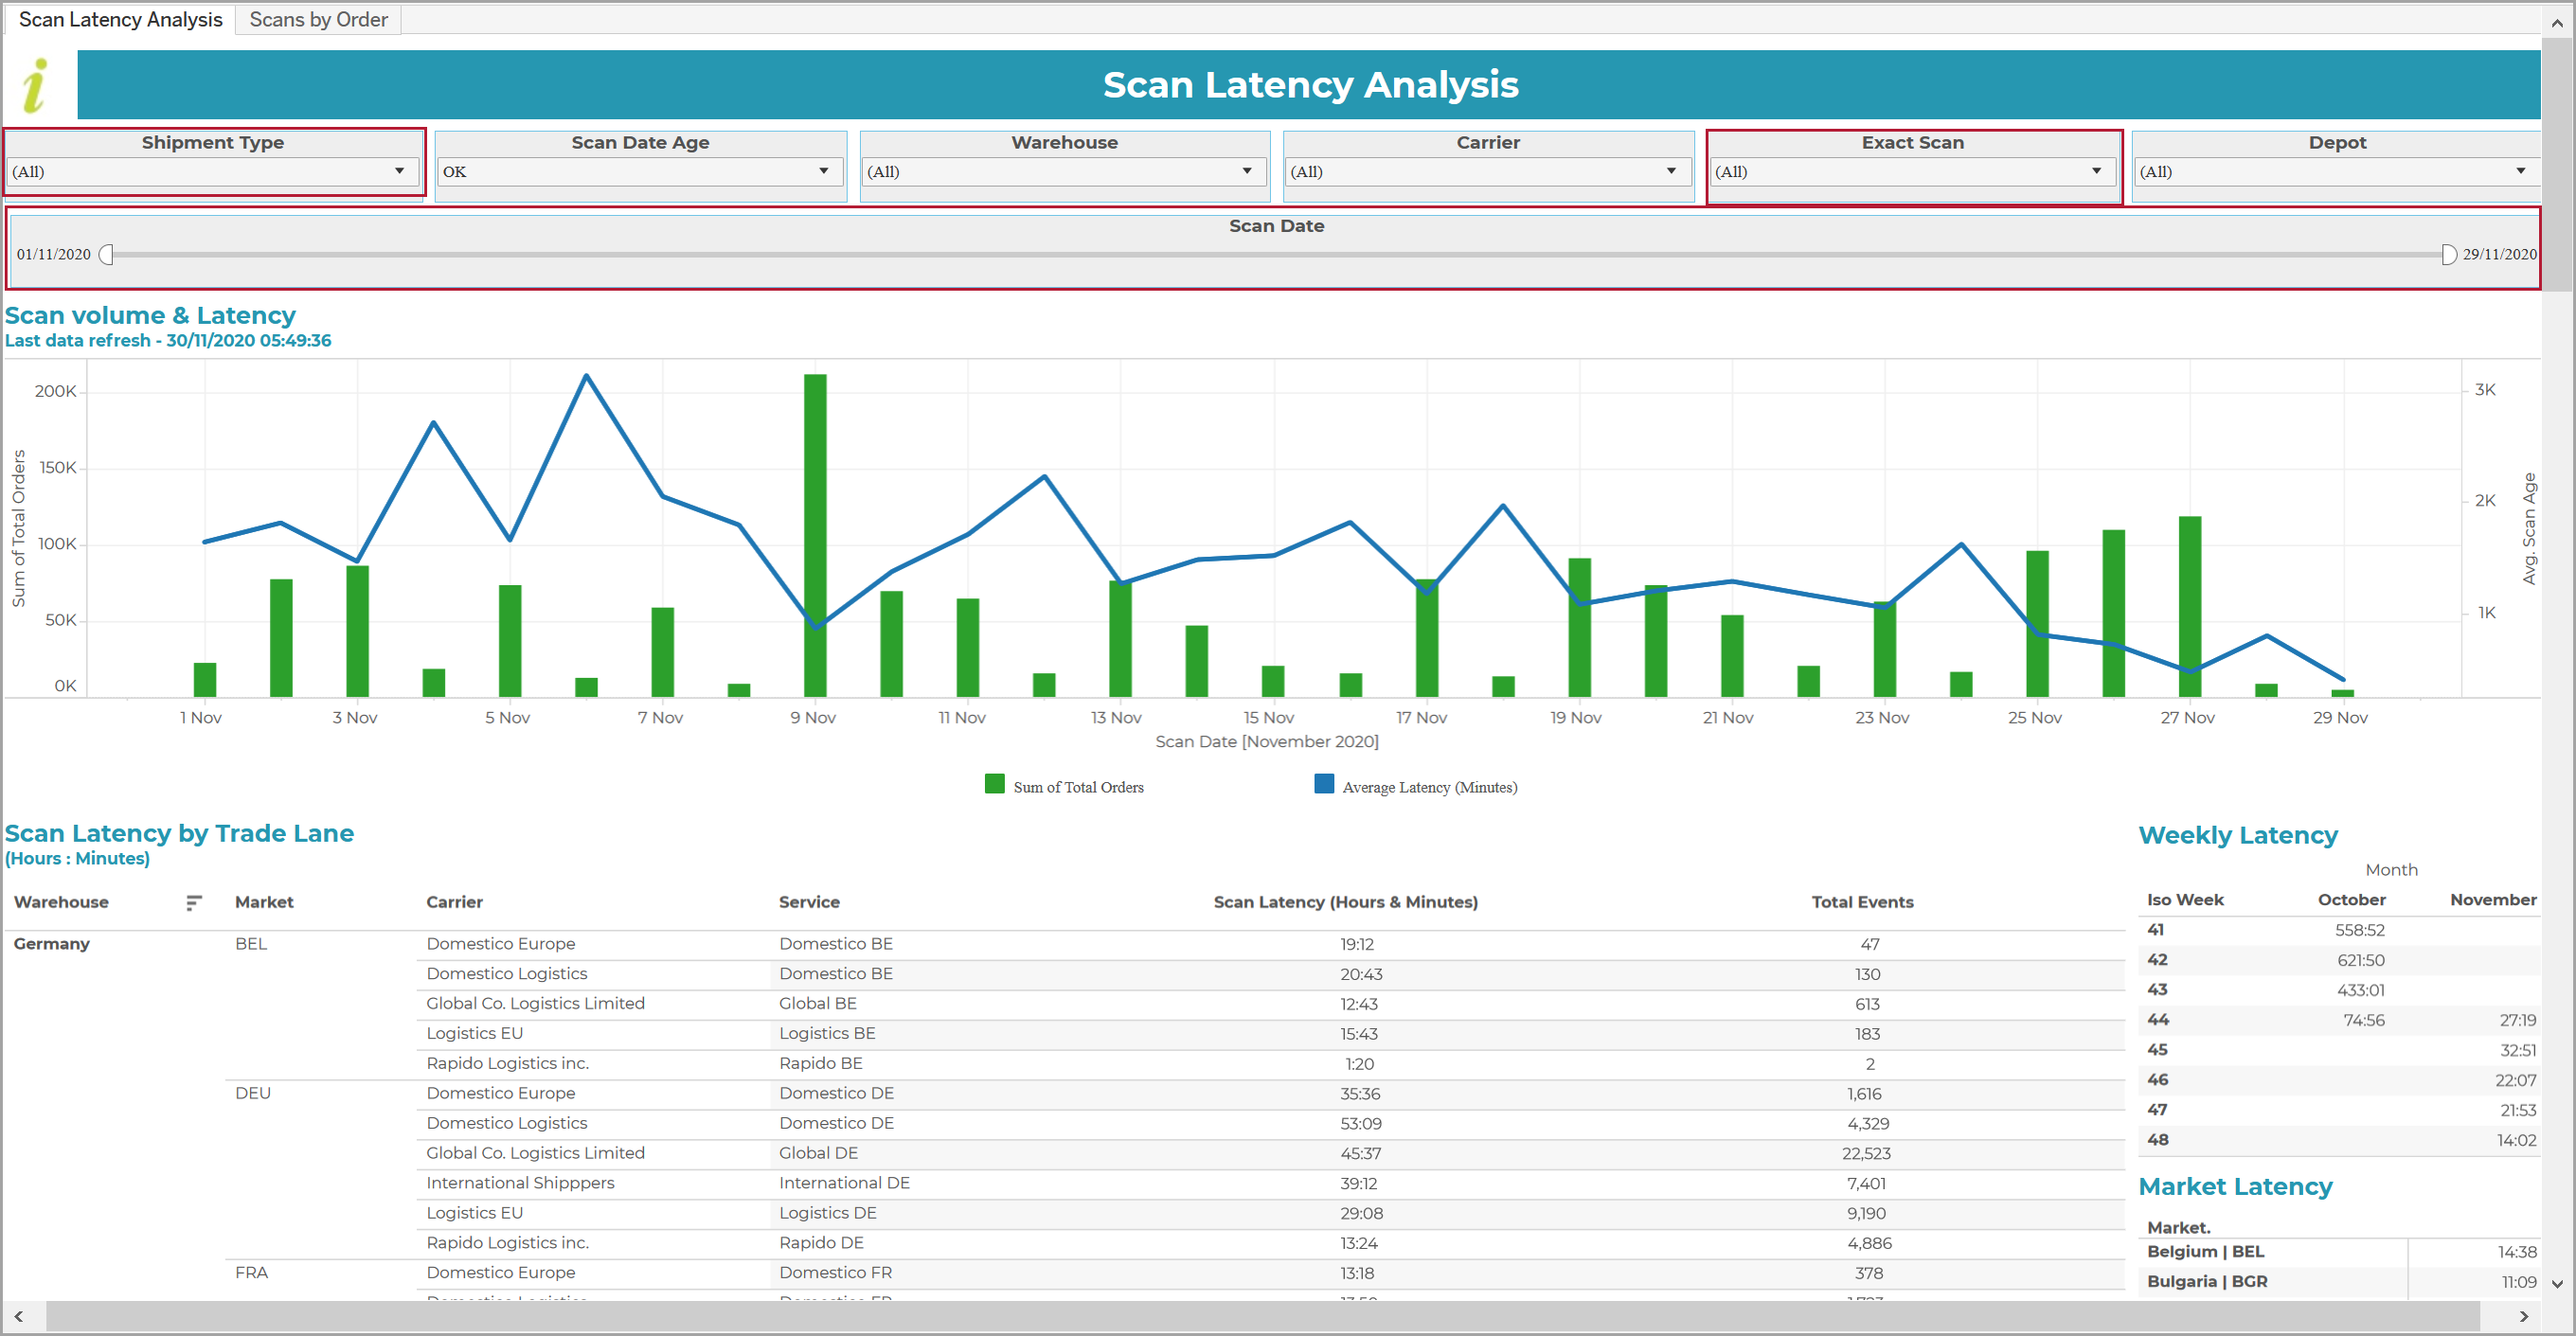
It looks at scan dates during the last 30 days, displaying a bar graph that shows, for each day, the orders scanned as compared against the average scan latency (i.e. lag) in hours and minutes.
The exact scan filter allows you to only show the data for specific scan events (otherwise, by default, the report shows the overall carrier plus parcel tracking latency).
You can use the report to:
Detect those carriers and carrier services for which there is unacceptable scan latency. Individual exact scan events can be selected to prove to the carriers which events are having the most negative effect on their overall latency.
In conjunction with the Carrier Scan Completeness report, gauge the accuracy of your exception and other reporting (e.g. the Carrier Review and Live Status report may not be able to be relied upon until there is an improvement in the latency of your scanned carrier events).
Drilling through from a cell in a trade lane takes you to a separate Scans by Order tab so that you can see the scans that are causing the associated latency.
Note
In the Service Level report and Carrier Performance by Delivery Date reports, you can leave All selected for Scanned into Carrier Network?, so that data is shown for all parcels, regardless of whether or not they have been scanned.
You might want to find out why you are seeing parcels in the Live Status report stuck at the same status (e.g. the Attempted Delivery status) without being recorded as Delivered.
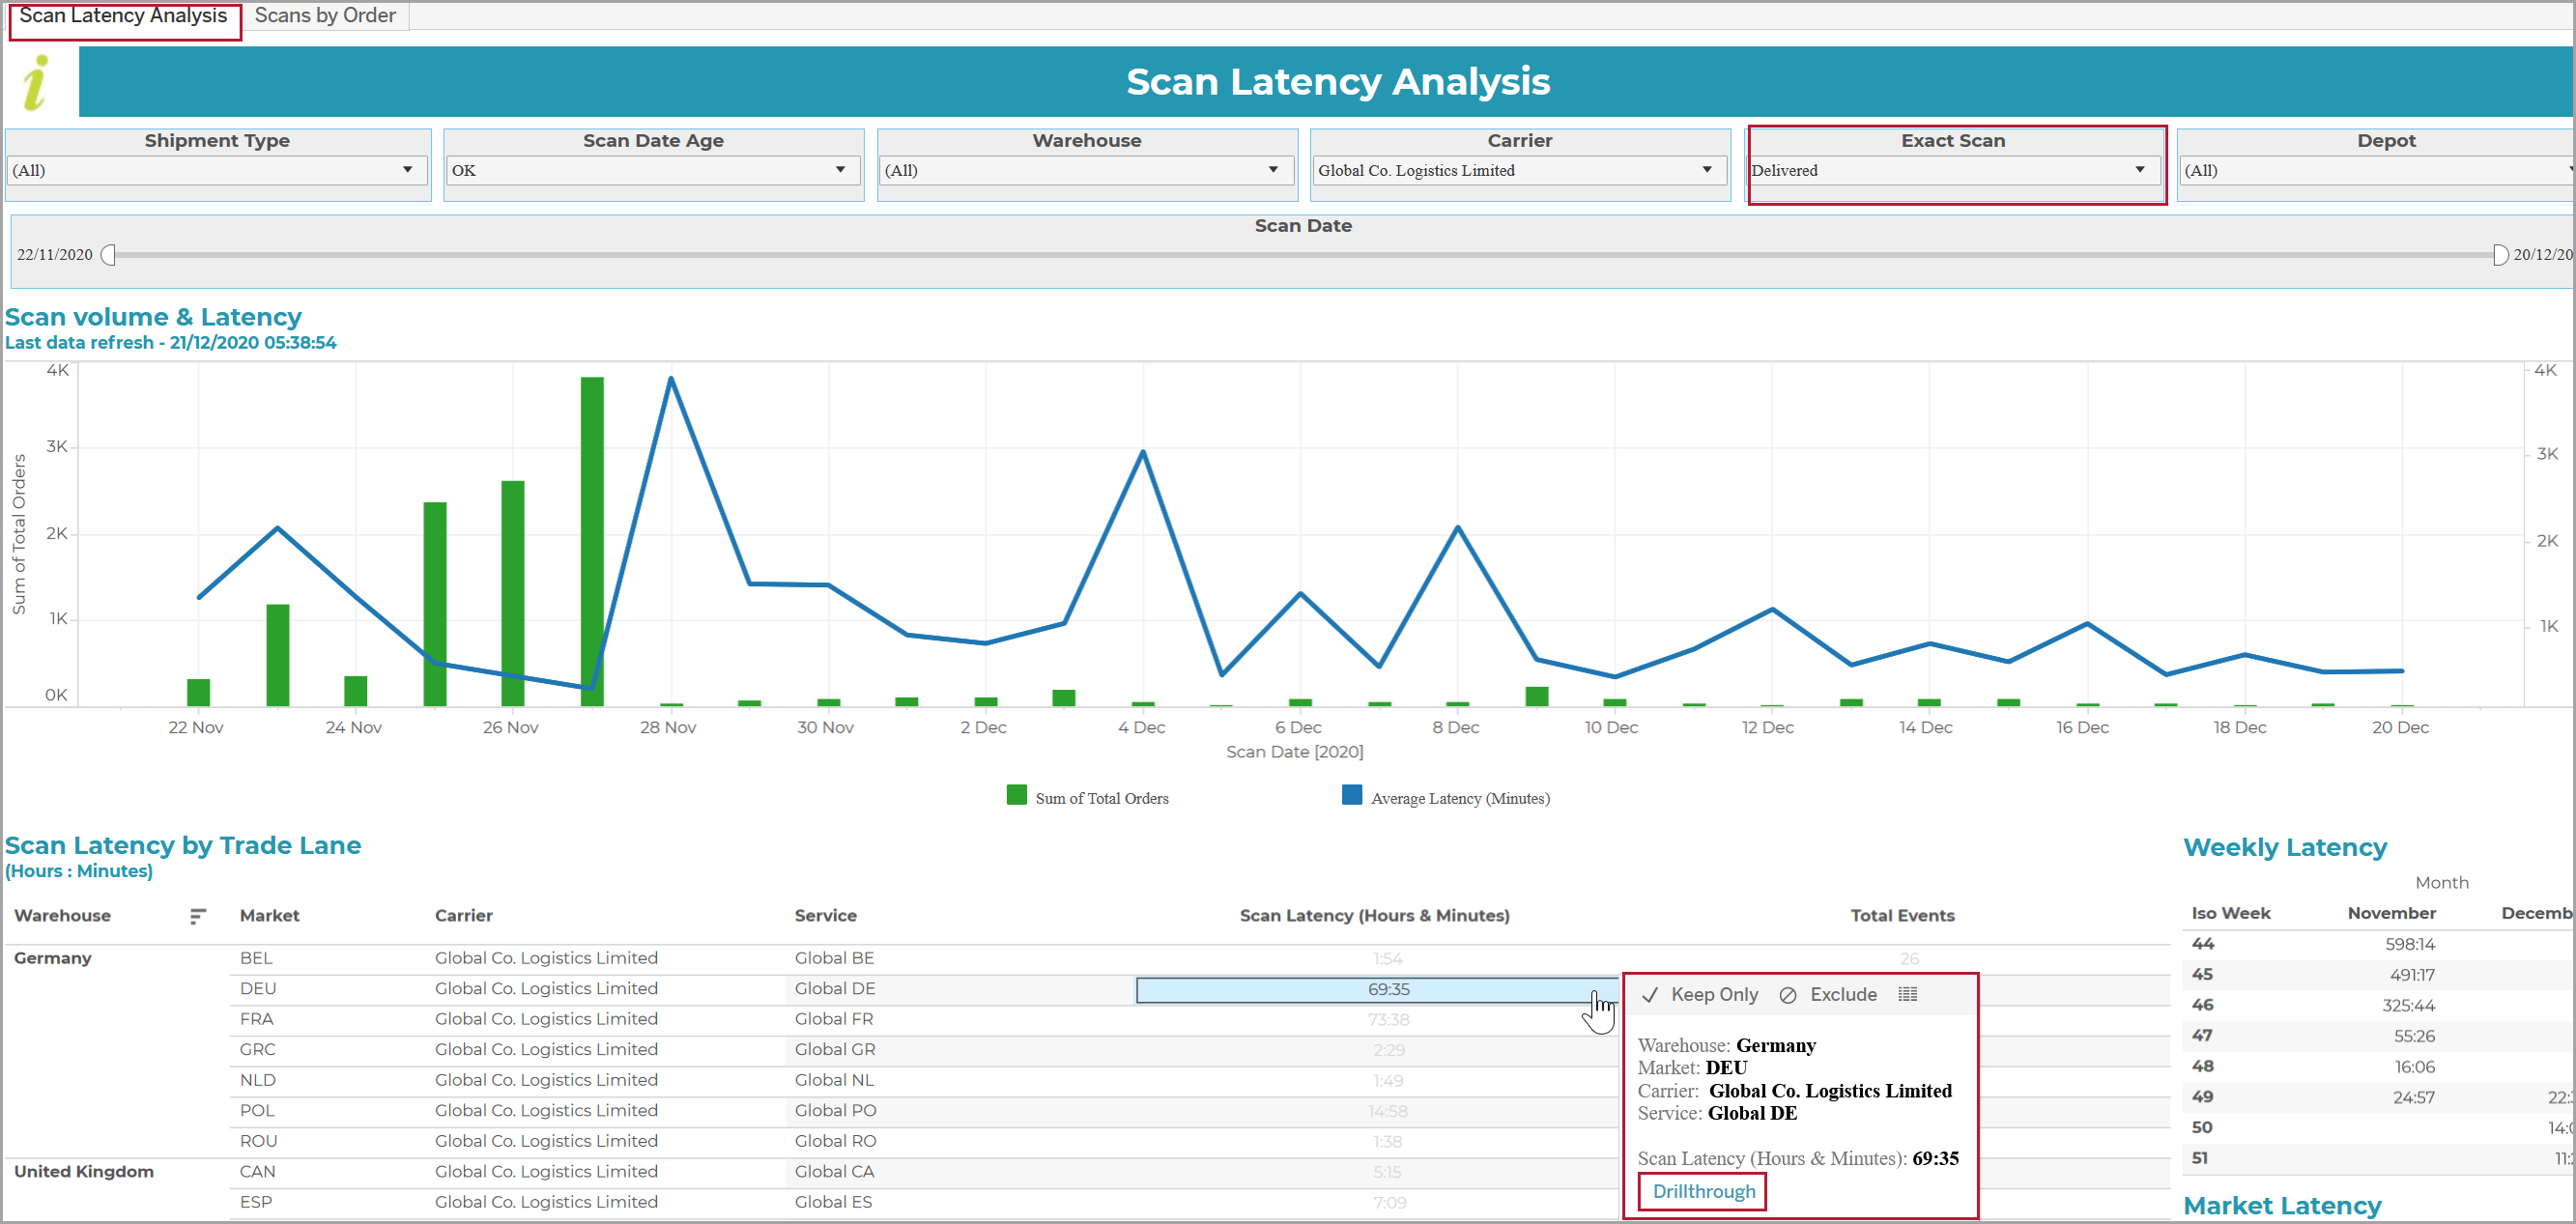
You would select the Delivered event as an Exact Scan event in order to reduce the dataset to just the latency for that type of event, and then keep only the desired carrier service:

You see that the scan latency for Delivered is unacceptable and backs up the Live Status report. You can then use the Drillthrough option to be taken to the Scans by Order tab so that you can take the requisite action.
In addition to the global filters previously described, the report provides the filters and switches highlighted in the following screenshot:

Shipment Type
This switch allows you to select whether the data is to be shown for Cross-Border shipments, Domestic shipments, or All (the default):

Exact Scan
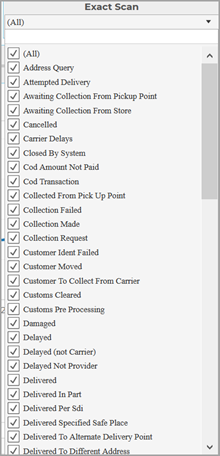
This filter allows you to reduce the default dataset by only selecting specific scan events. For example, you may want to see the explicit latencies for pickups, deliveries and/or exceptions.

All scan events are selected by default. To select the one(s) for which you wish to display data, first deselect All (so that (None) appears in the filter). Then select the one(s) required. To select a particular scan event, type part or all of the name at the top of the filter box (to restrict the display). Then tick it.
The report is automatically updated following your selection.
Scan Date
The scan date selector reflects the report's underlying data period. It allows you to filter the data according to a particular range of dates on which scan events occurred:

You can change the date range in either of two ways:
Use the mouse in conjunction with the slider.
Click the From and/or To date at either end of the slider to bring up a calendar control that allows you to manually select a date.
Notes on filtering by Trade Lane
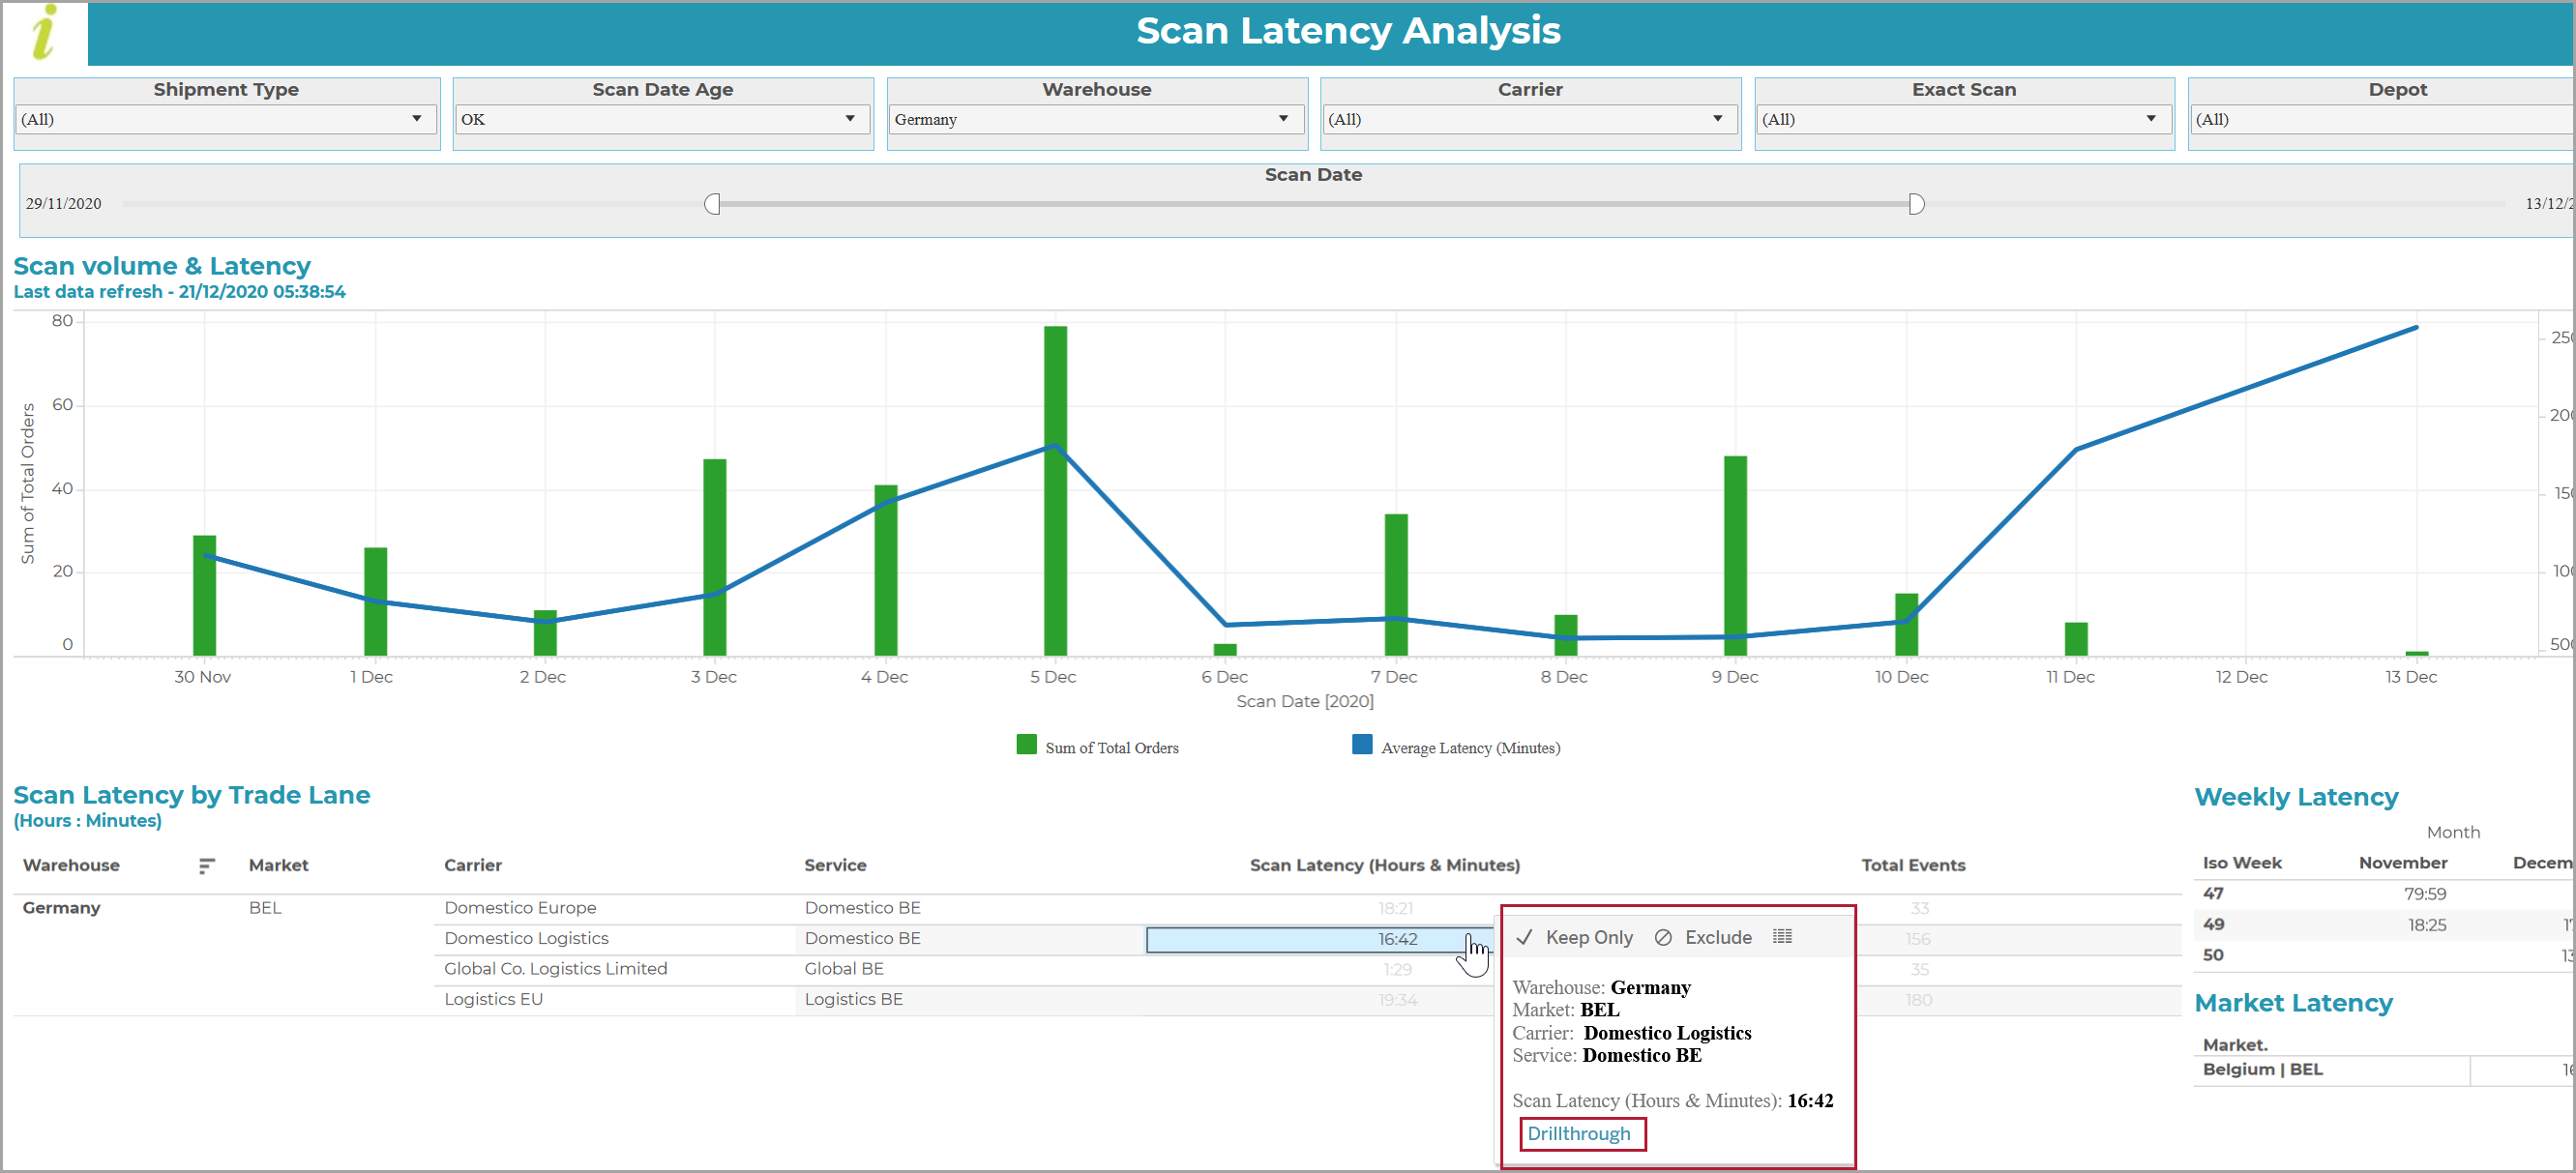
When you filter by trade lane, the reports show the Scan Latency (in hours and minutes) for the selected lane, plus the total number of associated events. If you hover over the trade lane, or any of the above columns, you will see the Drillthrough link that takes you to the Scans by Order tab, e.g.

Note
For the Keep Only and Exclude options that are displayed when you hover over the filter, refer to the Keep Only/Exclude switch.
If you click on Drillthrough, the individual scan events for the orders in the selected trade lane are displayed, e.g.

This allows you to look at the latency for individual events (shown on the far right of the above table).
You can use the Order Numbers and Consignment Codes on the left of the tab to identify the packages in Metapack Delivery Manager.