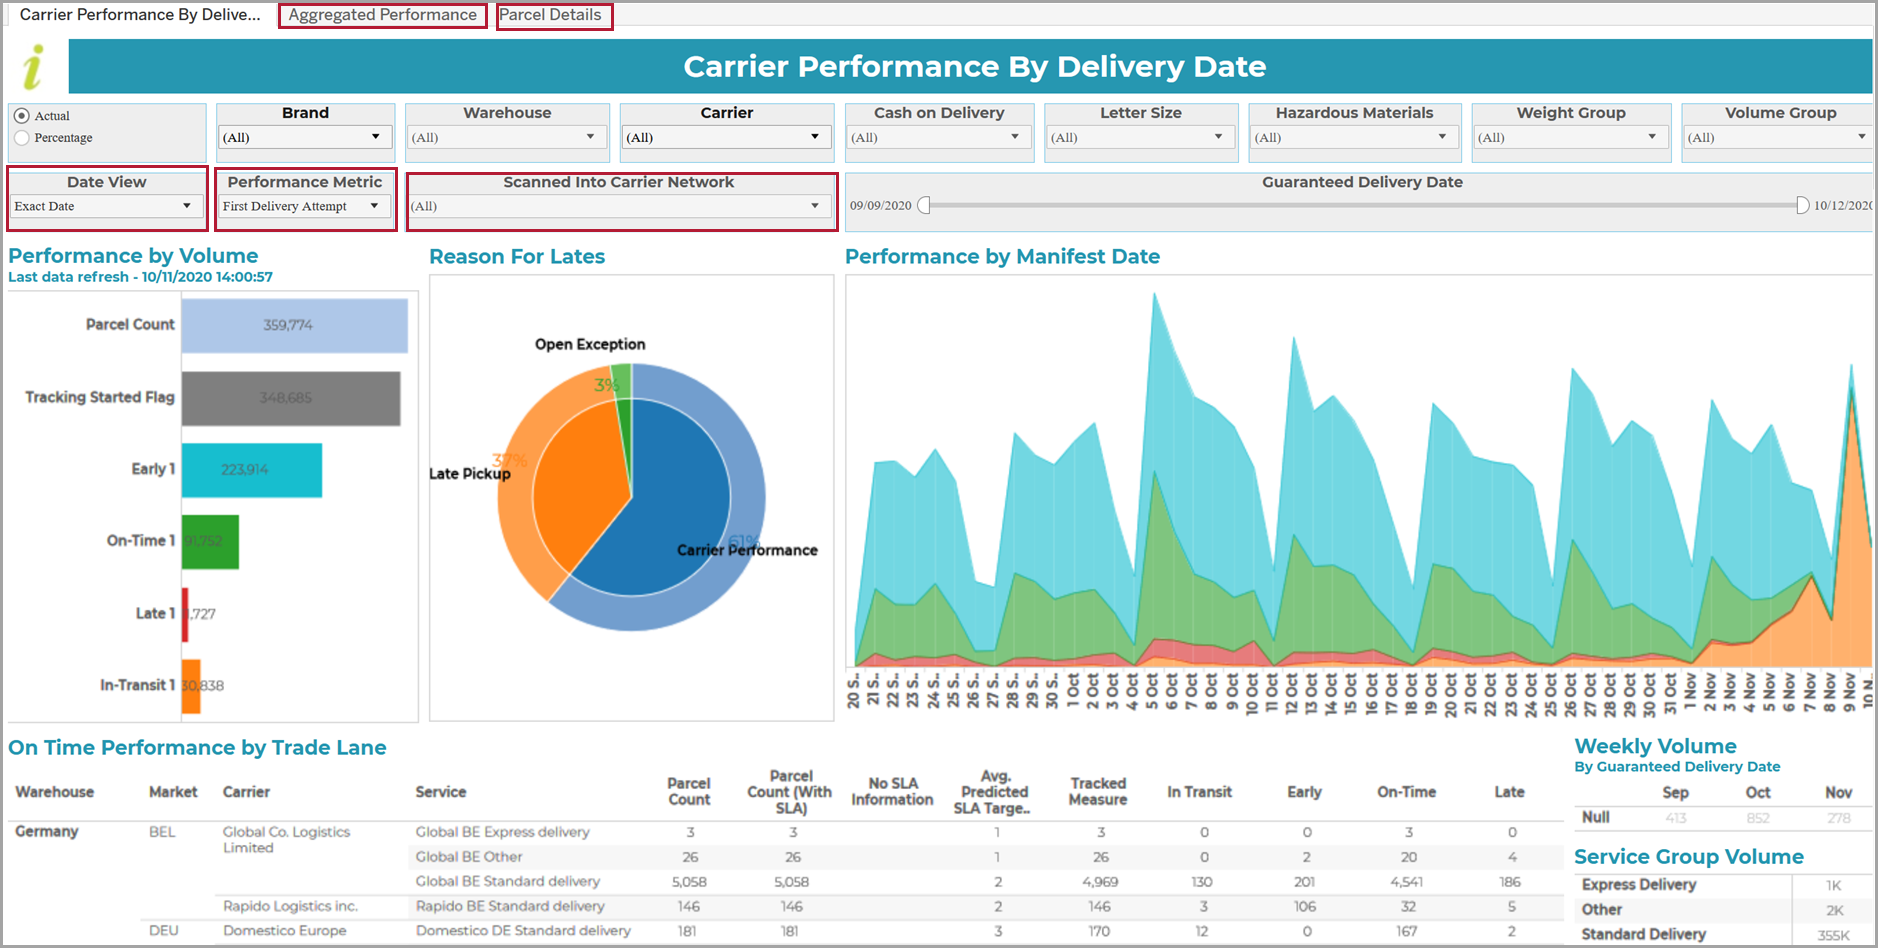
The Carrier Performance by Delivery Data report tells you how carriers performed in meeting customers' Guaranteed Delivery Dates during the last 50-day rolling period, and allows you to drill through to a Parcel Details tab.
The report provides both volume and time period breakdowns by delivery status (Tracked, Early, On Time, Late and In Transit), and a pie chart breakdown of the Reasons for Lates. For example, a certain percentage could have been caused by Late Pickup, which is down to failings in the warehouse as the carrier was not provided with the parcels prior to the cut-off time.
Note
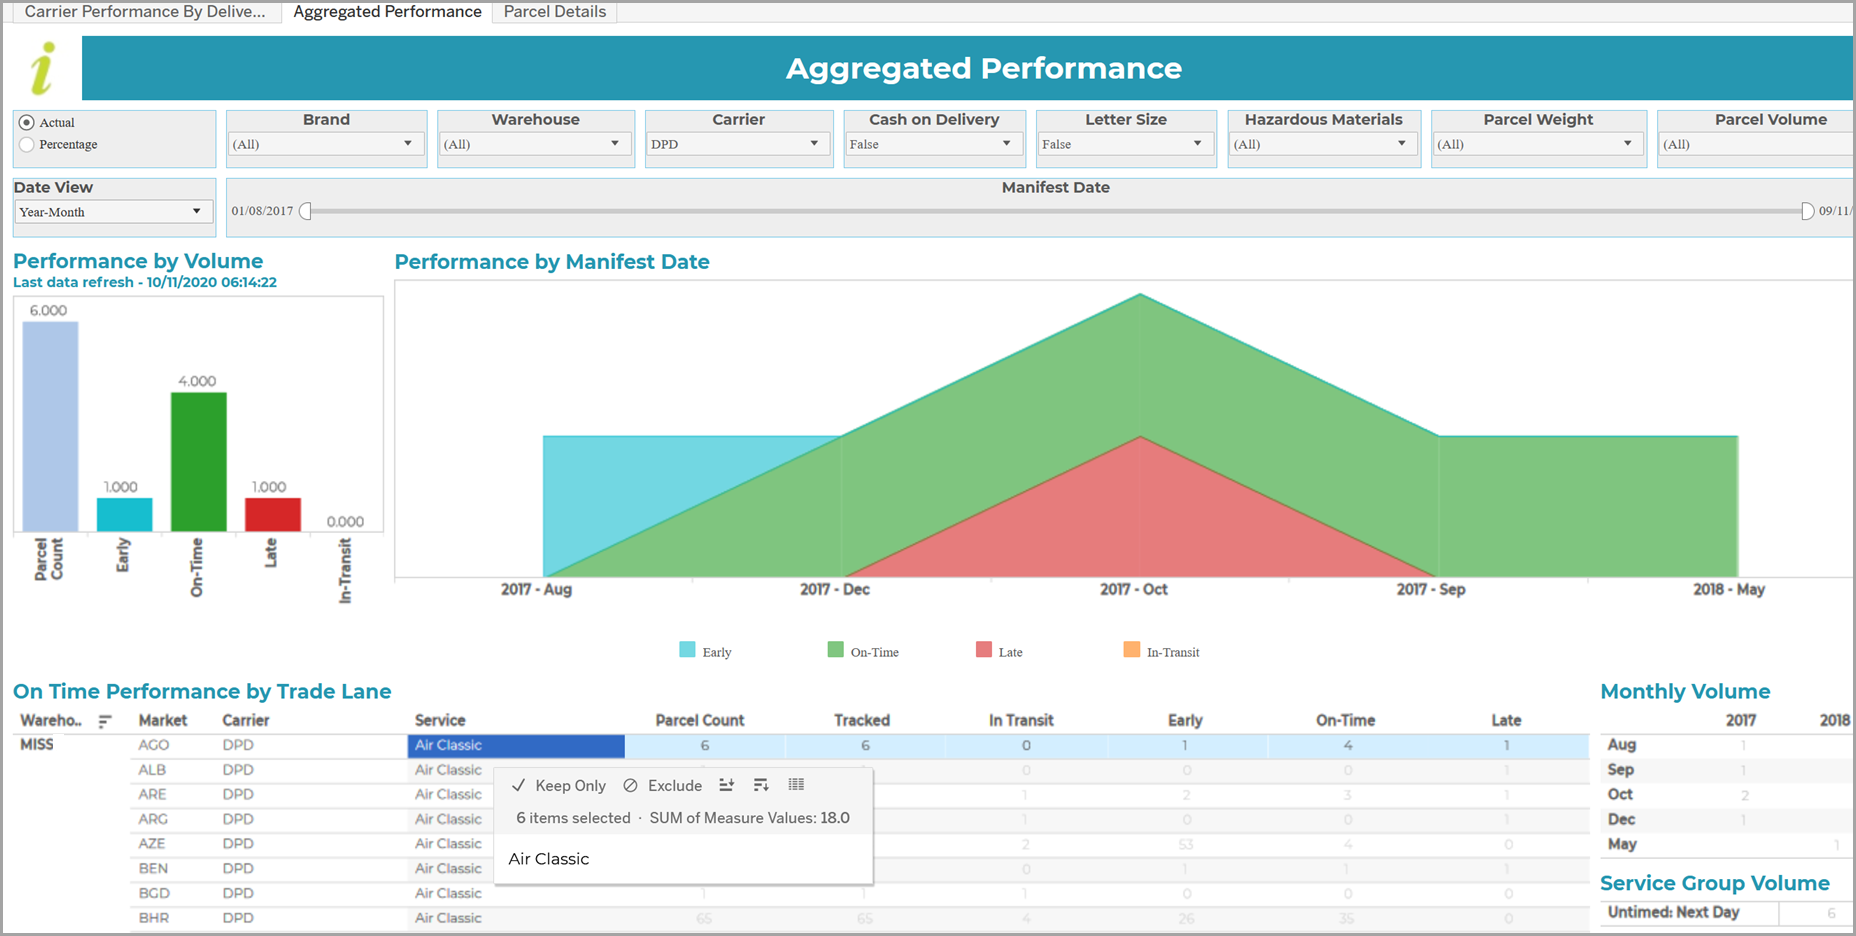
There is also an Aggregated Performance tab that allows you to see the same performance breakdowns but for aggregated parcel counts for the last 3 years. However, as it is not transactional data, there is no drill through to this tab.
You can use the report to:
Review whether customer delivery promises are being met in selected trade lanes. You do this by using the Actual Delivery performance metric in conjunction with the Performance by Manifest Date chart to view Late and In Transit deliveries. Customer Service Operatives can then drill through to the Parcel Details tab to look up individual parcels and manage customer expectations.
View the performance of a carrier or their individual services by selecting the required trade lanes and looking at the associated Performance by Volume chart to see the number of parcels that were late or are still in transit. If this is viewed in conjunction with the Performance by Manifest Date chart, the Transport Manager can view the pattern over time and use it as the basis of a discussion with the carrier.
Analyse why parcels are being flagged as late, by reviewing the Reason For Lates bar chart.
Let us say that you were concerned about a carrier service's late deliveries in the Swedish market. You might select the filters shown in the video below.
The final action is to drill through to the individual packages:
In addition to the global filters previously described, the report provides the filters and switches highlighted in the following screenshot:

Note
For information on how to populate the tabs shown at the top of the screen, refer to Viewing the Aggregated Performance tab and Drilling through to the Parcel Details tab.
Date View
This switch has two settings: Exact Date and Weekday.

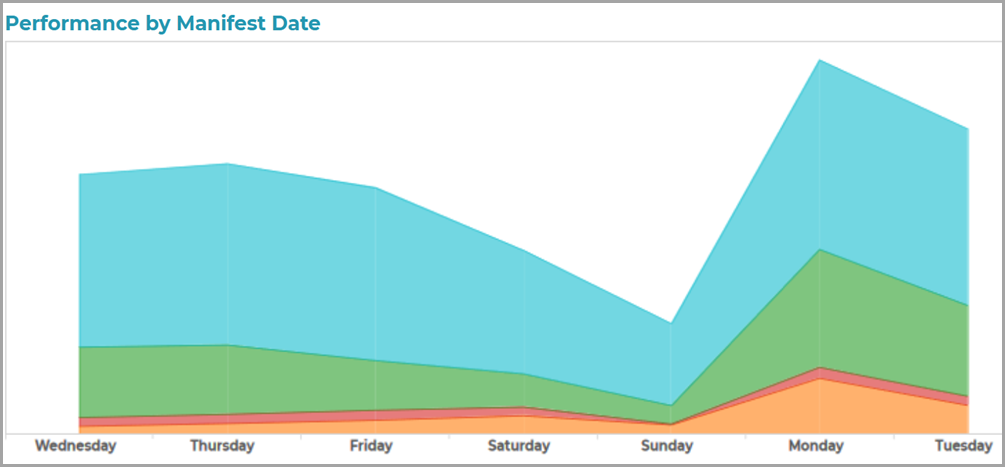
The switch allows you to determine whether the Performance by Manifest Date area chart on the right should show the exact dates at the bottom of the graph, or else group the values by days of the week, e.g.

Note
Going from top to bottom, the colours correspond to the delivery statuses Early, On Time, Late and In Transit, respectively.
Performance Metric
You can set the metric against which lateness in the report is to be measured:

This switch determines whether the actual delivery against which the Guaranteed Delivery Date is measured, is to be taken as the First Delivery Attempt (the default), or else the Actual Delivery into the customer's hands.
Scanned into Carrier Network?
This filter allows you to determine whether or not to include data for 'non-scanned' parcels (i.e. parcels that were not tracked and those for which labels were printed but which were never shipped):

This flag has been implemented as a Boolean indicator. You can select Yes to filter out 'non-scanned' parcels, No to show data for just the non-scanned parcels, or All (the default) to find all parcels (regardless of whether or not they have been scanned into the carrier network).
Notes on filtering by Trade Lane
Each trade lane has an on-time delivery SLA that has been agreed with the particular carrier. For each selected trade lane, values are supplied for the following:
-
Parcel Count
The total number of parcels manifested within the criteria set by the switches.
-
Parcel Count (with SLA)
The total number of parcels manifested that are subject to an SLA (typically, the same as Parcel Count).
-
No SLA Information
The total number of parcels for which there are no SLA details (typically, Parcel Count minus Parcel Count (with SLA)).
-
Average Predicted SLA Target
The average number of days calculated as the delivery SLA in the selected trade lane.
-
Tracked
Those parcels for which at least one tracking scan has been received from the carrier. Where tracked services are used exclusively by the carrier, this value is expected to be identical to the Parcel Count or the Parcel Count (with SLA).
-
In Transit
The number of parcels that have received tracking events from the carrier but that have not yet had a 'stop the clock' event.
Note
'Stop the clock' events are those that signify tracking as 'completed', e.g.
Address Query, Attempted Delivery, Cancelled, Collected From Pickup Point, Customer Identification Failed, Delivered, Delivered per Special Instructions / Safe Place, Delivered to Different Address, Delivered to Pickup Point, Delivery Refused, No Access to Destination Address, Out For Delivery, Partial Delivery, Recipient Carded, Refused by Recipient, Return to Sender.
Refer also to Carrier Scan Completeness report.
-
Early
The number of parcels that had a 'stop the clock' event prior to the carrier's Earliest Delivery Date.
-
On Time
The number of parcels that received a 'stop the clock' event between the carrier's Earliest Delivery Date and Guaranteed Delivery Date.
-
Late
The number of parcels that received a 'stop the clock' event after the Guaranteed Delivery Date, plus any that have passed the carrier's Guaranteed Delivery Date and are still in transit.
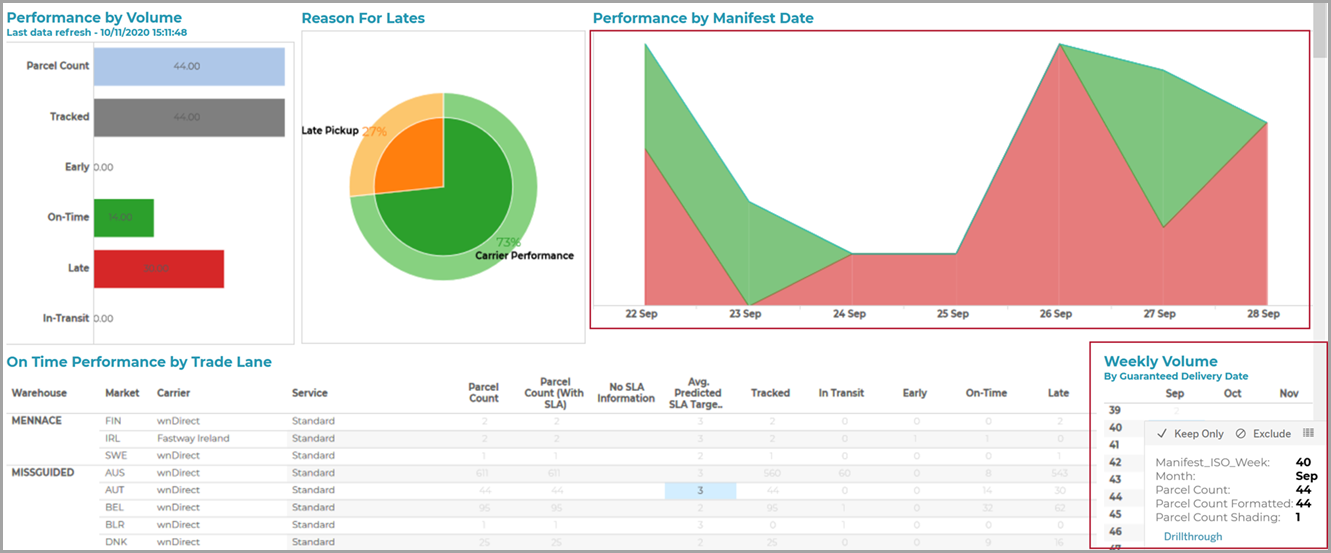
If you hover over the trade lane, or any of the above columns, you will see the Drillthrough link that takes you to the Parcel Details tab, e.g.

Note
For the Keep Only and Exclude options that are displayed when you hover over the filter, refer to the Keep Only/Exclude switch.
Weekly Volume
This 'quick filter' allows you to select an individual ISO week for which you wish to show data:

When you click on the week, the report data is filtered to show only the results for the particular week. If you hover over the link, you will see the Drillthrough link that takes you to the Parcel Details tab.
You simply click again to clear the filter. To clear a multiple selection, click multiple times. You can also select Undo/Redo to clear a filter.
Note
For the Keep Only and Exclude options that are displayed when you hover over the filter, refer to the Keep Only/Exclude switch.
You can also click on the Aggregated Performance Tab to view a version of the Carrier Performance Report combining up to 3 years' manifested parcels data, e.g.

Under this tab, there is no Performance Metric switch, and the Date View switch provides the following selections:

If you click on Drillthrough, the individual parcels are displayed on the Parcel Details tab, e.g.

This allows you to look at individual parcels. You can also reset the Performance Metric switch at the top of the screen, and select the status for which you wish to view parcels (via the Parcel Status switch).
You can use the Order Numbers and Consignment Codes on the left of the tab to identify the packages in Metapack Delivery Manager.