For a specified type of transit event, the Lead Time Statistics report tells you how many parcels were processed during the different time bands of the event during the last 50-day rolling period. For example, if you set the transit time to Carrier pickup to final event, and set the final event to Actual Delivery, you can highlight the average numbers of days that a carrier service, or carrier services within a particular service group, took to deliver parcels into a customer's hands.
The report allows you to:
Determine which carrier services are not meeting their SLAs in terms of customer delivery times, by setting the transit time to Final Mile.
Adjust customer promise and expectations based on actual past performance. You can do this by using the default transit time of Creation to End to see the actual time that most packages take to be delivered from ordering through to Actual Delivery, and then adjusting the delivery estimates on your website.
See how long manifested packages are taking to be picked up. You can do this by setting the transit time to Line Haul to see how many hours it is taking parcels to be picked up after they have been manifested.
Investigate consumer complaints related to individual packages that have failed carrier SLAs. Customer Service Operatives do this by drilling through to the Parcel Details tab.
Let us say that you were concerned about a carrier's delayed shipments in the German market. You might select the filters shown in the video below.
The final action is to drill through to the parcel details:
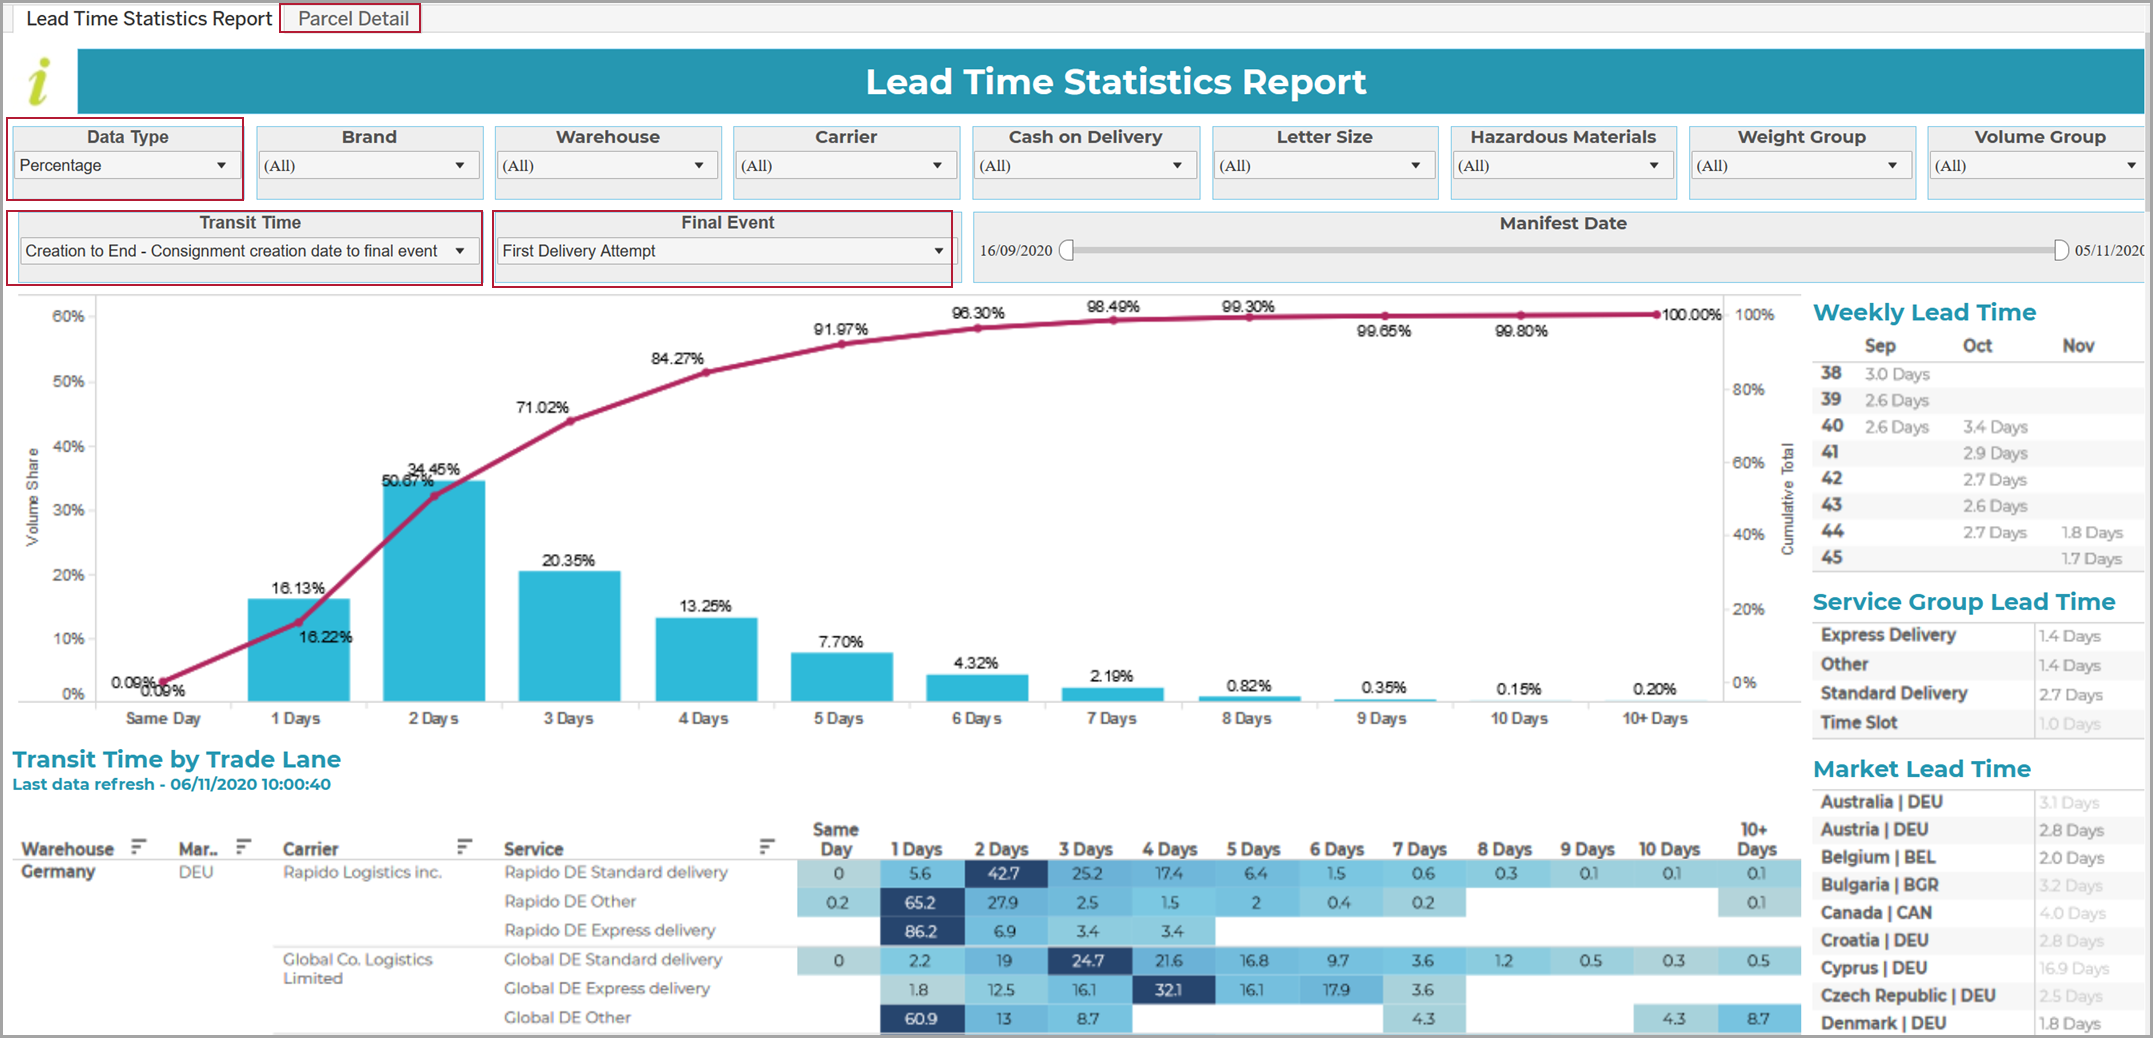
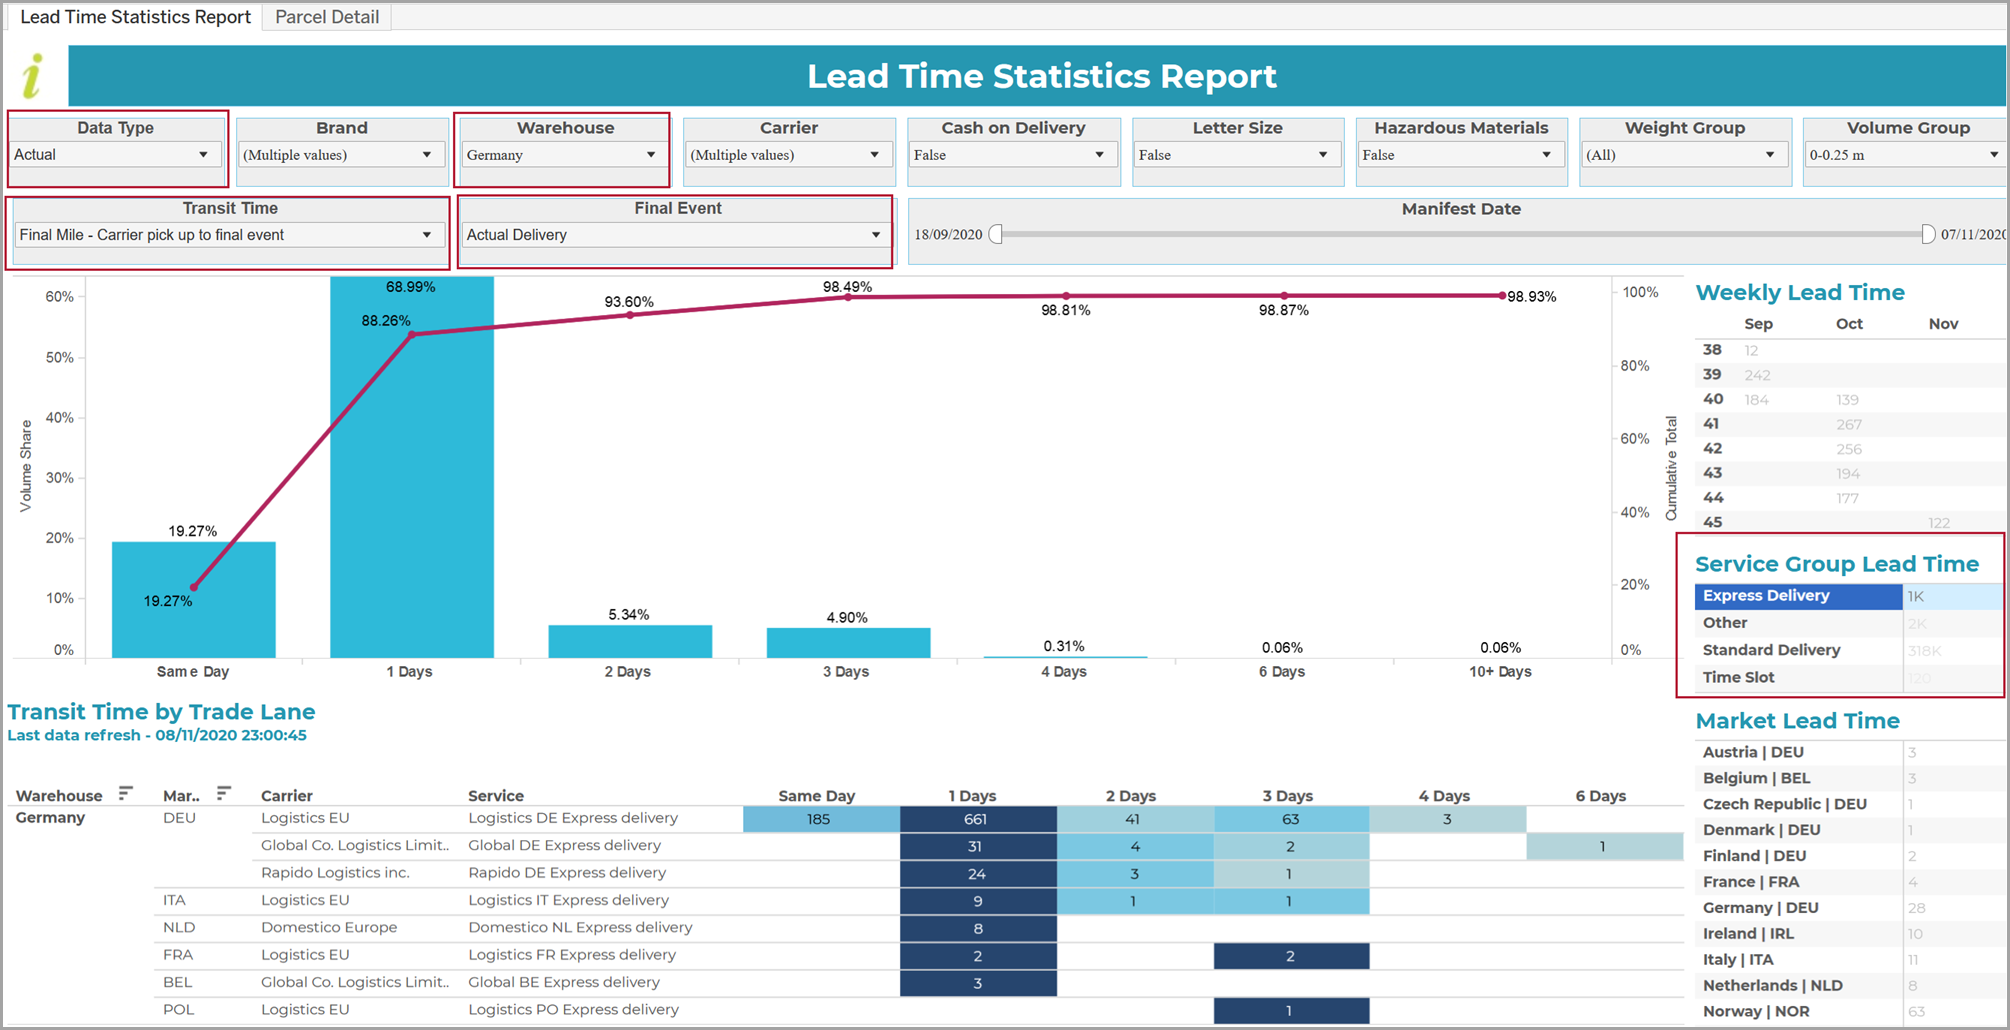
In addition to the global filters previously described, the report provides the filters and switches highlighted in the following screenshot:
Note
The top red line shows the cumulative figure, whilst the blocks below it show the individual figures for each time band.
Once you click away from a switch after changing it, the graph, trade lanes and weekly, 'service group' and market 'slicers' are updated automatically in line with your selection.
For the population of the Parcel Details tab shown at the top of the screen, refer to Drilling through to the Parcel Details tab.
Data Type
This switch applies to the trade lanes below the graph and allows you to select how the numbers of parcels processed within the different time bands are to be represented:
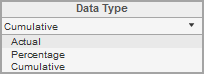
Select the required option:
Actual for each number to be shown as a numeric value;
Percentage for each number to be shown as a percentage of the overall number of parcels processed;
Cumulative for each number to be shown as a percentage after adding in the figures from the previous time periods.
Transit Time
The Transit Time switch allows you to specify how the transit event is to be defined for the current dataset:
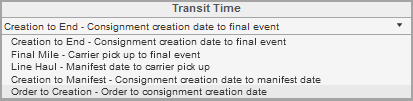
The events are self-explanatory. The time bands for the top two events are days, whereas those for the bottom three events are hours.
Creation to End is the default Transit Time.
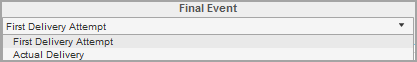
Final Event
Where Final Event is specified in a transit time selection, this switch allows you to determine what the Final Event is for the current dataset - i.e. it can be either the First Delivery Attempt (the default), or the Actual Delivery into the consumer's hands:
Notes on filtering by Service Group
When you filter the data by service group, you can quickly see whether the services within a particular group (e.g. Express Delivery) are fulfilling their SLAs.
The combination of the above filters and switches allows you to quickly see where the problems are at any stage in the delivery chain, and, by drilling down, to quote details of specific parcels.
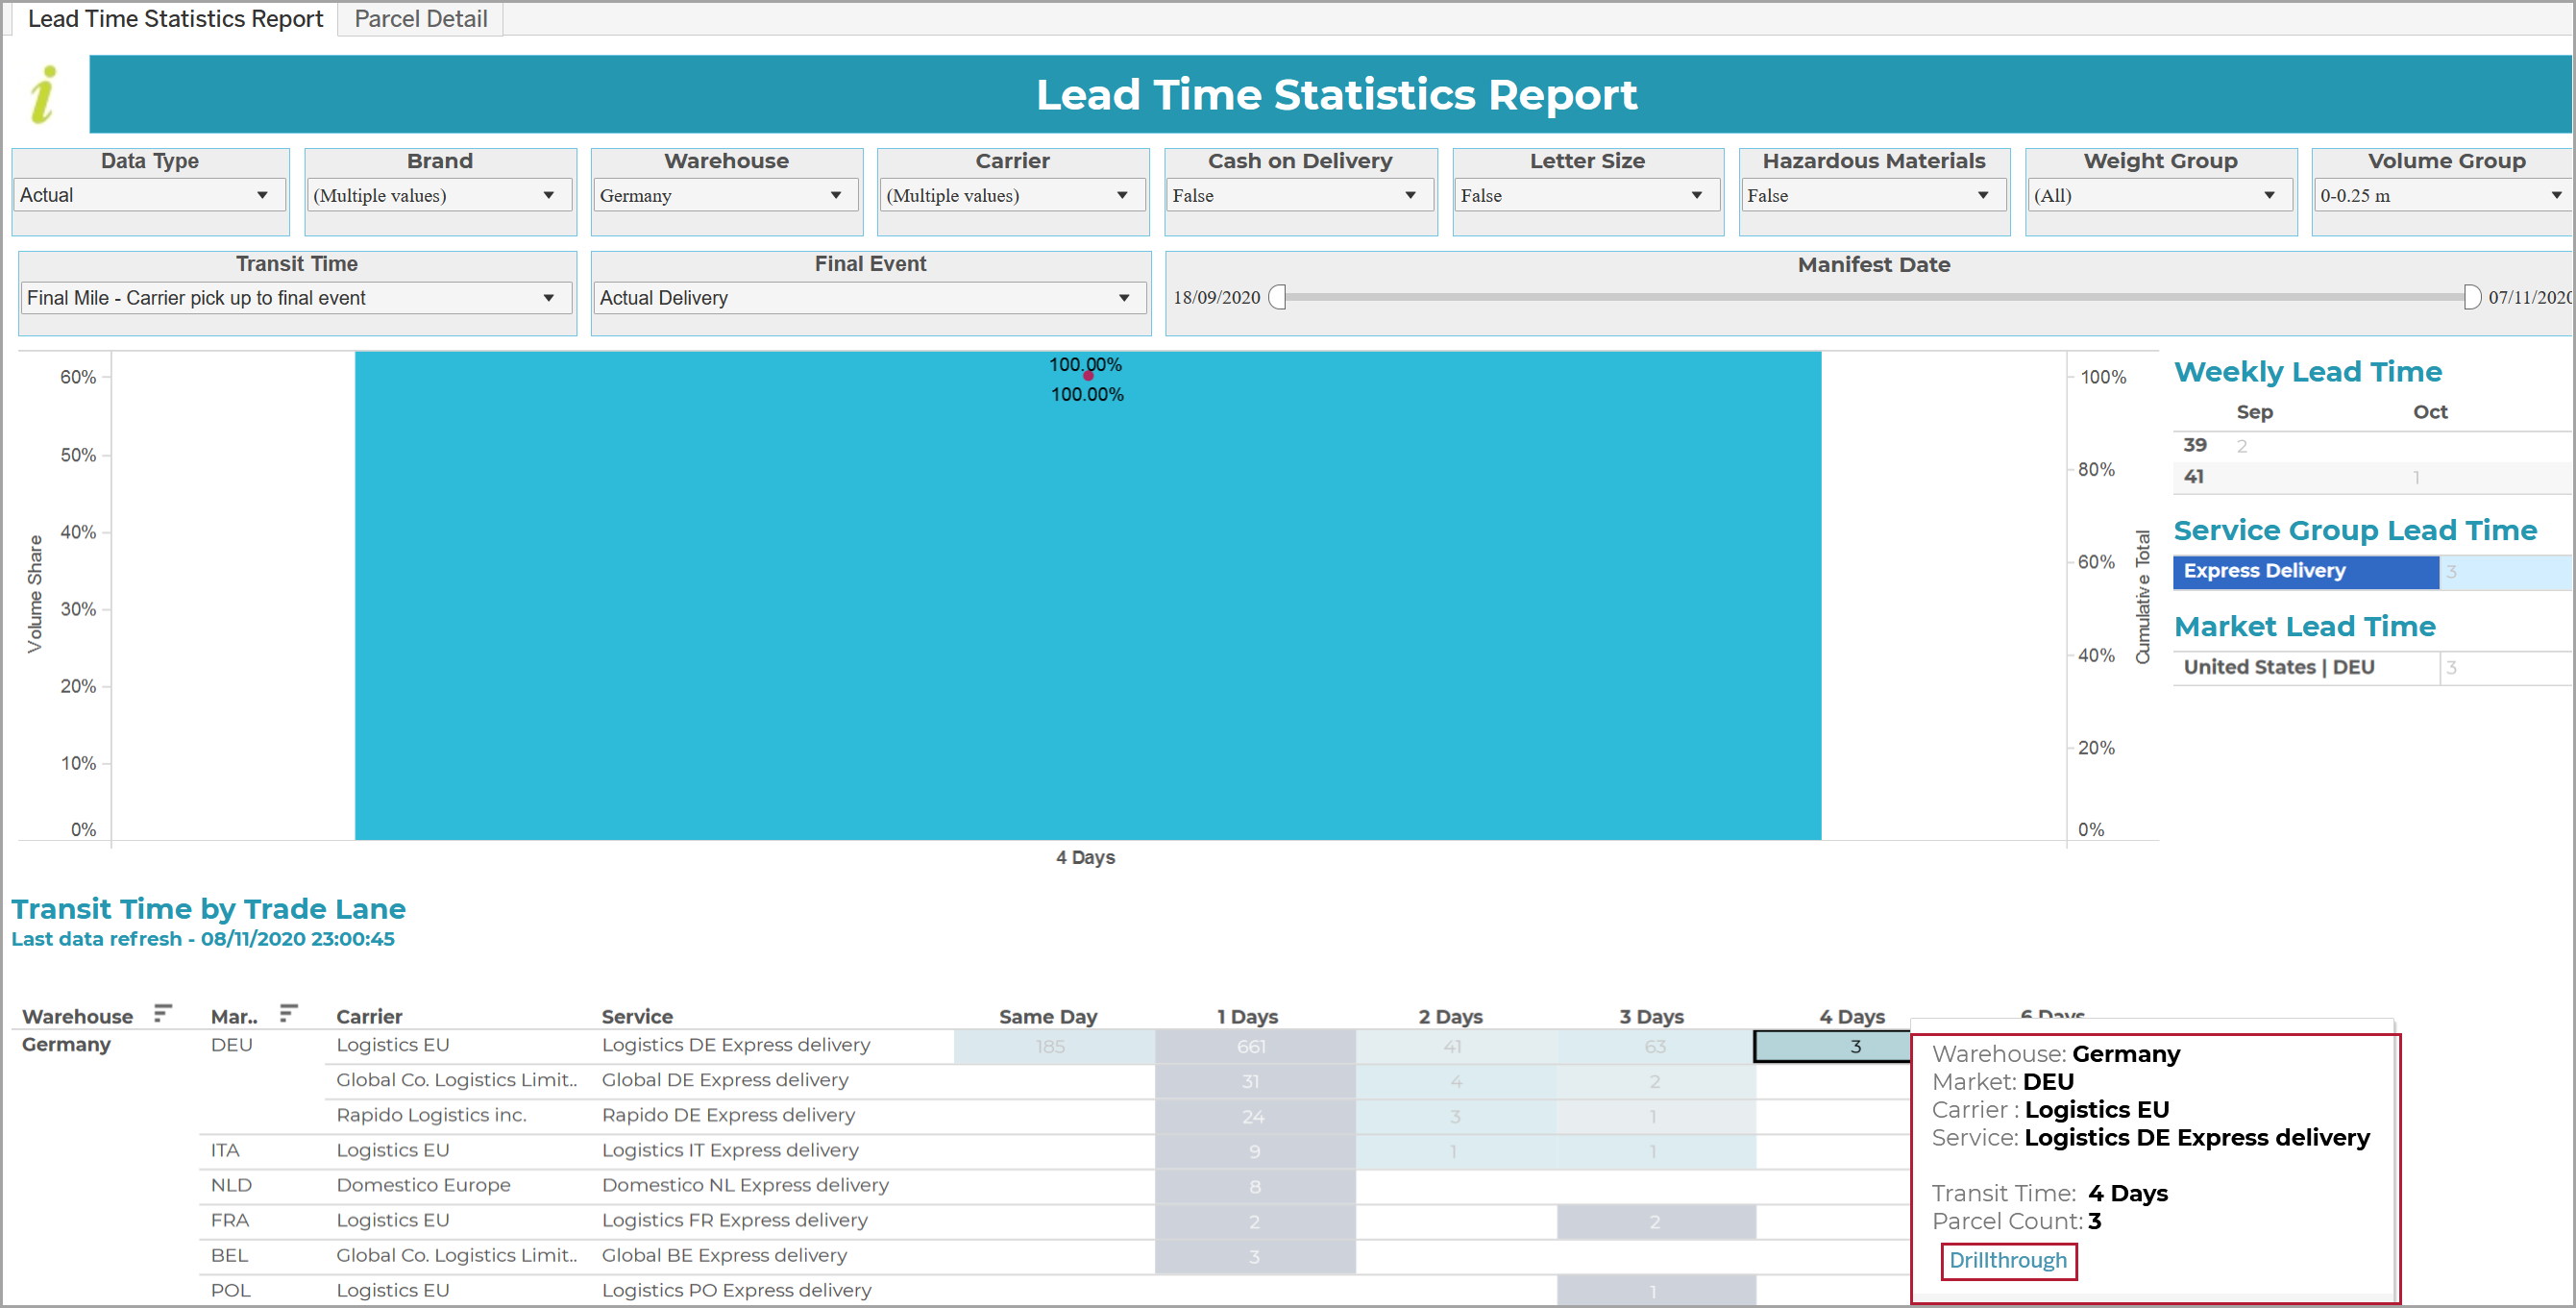
For example, the following report shows the parcels picked up from the German warehouse by services within the Express Delivery service group. It highlights the actual numbers of those parcels that were delivered into consumers' hands during the different time bands, and immediately demonstrates that some services are not fulfilling the Express criteria:
If you select a trade lane in the above example, and hover over one of the time bands, a Drillthrough link is displayed:
Parcel Details tab
If you click on Drillthrough, the parcels that were delivered during the time band are displayed under the Parcel Details tab, e.g.

This view allows you to to compare delivery with the SLA Target Days (the link in the example was for parcels that took 4 days to be delivered and so they all missed their target). It also allows you to see by how many hours each parcel was delayed between its Guaranteed Delivery and Actual Delivery Date, and the postcodes to which they were delivered. This is information that you can take up with the carrier.
You can use the Order Numbers and Consignment Codes on the left of the tab to identify the packages in Metapack Delivery Manager.