The Service Level report provides a heat map of late deliveries during the last 50-day rolling period, highlighting deficient and at risk markets.
Note
You can set your own thresholds to change which markets are highlighted.
The report allows you to slice the data by warehouse, carrier, carrier service, parcel weight, parcel volume, ISO week, service group and market.
You can use the report to:
Identify the deficient and at risk areas of the delivery chain. The Transport Manager can do this by slicing the report by warehouse and then drilling through to the deficient markets (highlighted in red), and at risk markets (highlighted in amber), to establish the reasons.
Detect where carrier SLAs are not being met by setting the red and amber thresholds that correspond to these SLAs. The Transport Manager can view the performance of a carrier or their individual services in the SLA Performance and Average Predicted SLA Target columns and then drill through to the Late Service Level Report to find out which postcodes are suffering the worst service.
Investigate consumer complaints related to individual packages. Customer Service Operatives do this by drilling through to the Late Parcels tab.
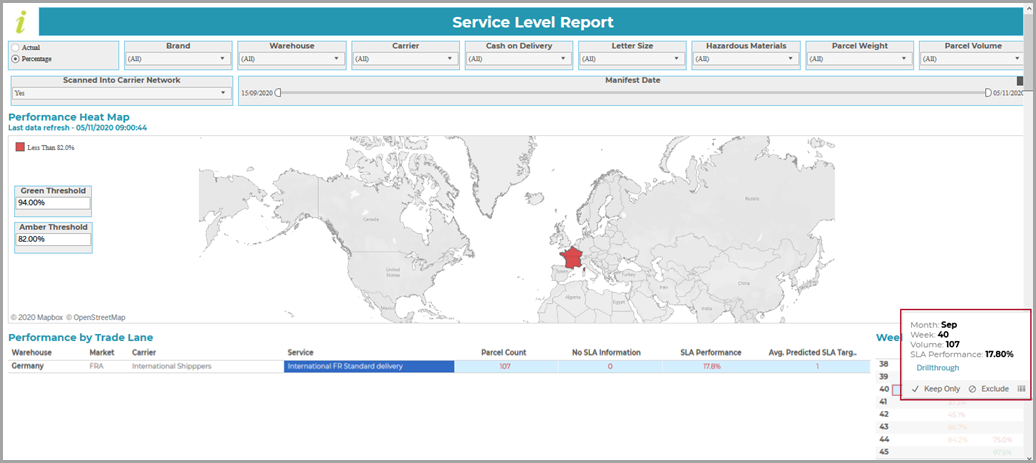
You might want to find out what percentage of parcels were delivered late to French addresses by a particular carrier service during ISO week 40, and so, following selection of the carrier service and week, you can use the Keep Only option to exclude other data:
Note
The Amber Threshold defines what is meant by 'late'.
When you hover over the selected trade lane or week, you are given the Drillthrough option to take you through to the Late Parcels tab and see how many parcels were late for each postcode, e.g.

In addition to the global filters previously described, the report provides the filters and switches highlighted in the following screenshot:
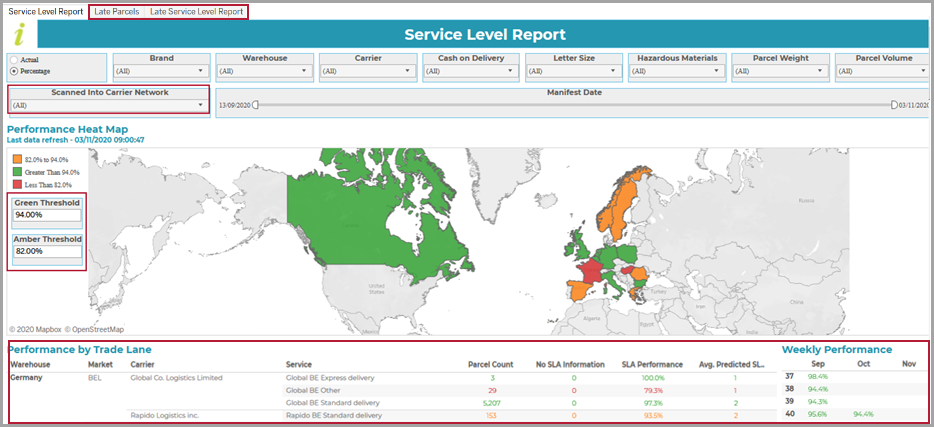
The map is interactive, and you so you can click on a failing territory to display its trade lanes below the map.
Note
For information on how to populate the Late Parcels and Late Service Level Report tabs shown at the top of the screen, refer to Drilling through to your late parcels.
Scanned into Carrier Network?
This filter allows you to determine whether or not to include data for 'non-scanned' parcels (i.e. parcels that were not tracked and those for which labels were printed but which were never shipped):

This flag has been implemented as a Boolean indicator. You can select Yes to filter out 'non-scanned' parcels, No to show data for just the non-scanned parcels, or All (the default) to find all parcels (regardless of whether or not they have been scanned into the carrier network).
Heat Map Thresholds
You can set the thresholds below which a market becomes at risk (amber) or deficient (red):
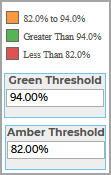
In the above example (which shows the default thresholds):
If the SLA performance of a market is less than the Amber Threshold (82%), then it is seen as deficient (shown as red on the map).
If the SLA performance of a market is between the Green and Amber Thresholds (i.e. between 82% and 94%), then it is seen as at risk (shown as amber on the map).
If the SLA performance of a market is greater than the Green Threshold (94%), then it is seen as meeting the SLA criteria (shown as green on the map).
Note
The logic of the heat map is that, if a particular carrier or service is failing a set SLA threshold, then the entire country is highlighted in red or amber. Therefore, the map shows the performance of the lowest denominator so that Transport Managers have a simplified view.
You cannot set a threshold below 70%.
Notes on filtering by Trade Lane
Each trade lane has an on-time delivery SLA that has been agreed with the particular carrier. For each selected trade lane, values are supplied for the following:
Parcel Count
No SLA Information (i.e. the number of parcels for which there are no SLA details).
SLA Performance (i.e. the percentage of parcels that were delivered 'late', where the Amber Threshold defines what is meant by 'late').
Average Predicted SLA Target (i.e. the average number of days calculated for delivery of a package in the selected trade lane).
If you hover over the trade lane, or any of the above columns, you will see the Drillthrough link that takes you to the Late Parcels tab, e.g.

Note
For the Keep Only and Exclude options that are displayed when you hover over the filter, refer to the Keep Only/Exclude switch.
Weekly Performance
This 'quick filter' allows you to select an individual ISO week for which you wish to show data (provided that you have previously selected a trade lane):
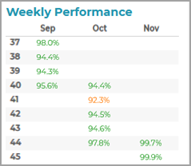
The colours of the values reflect the Heat Map Thresholds, and the type of value is determined by the setting of the Actual/Percentage switch.
When you click on the week, the report data is filtered to show only the results for the particular week. If you hover over the link, you will see the Drillthrough link that takes you to the Late Parcels tab:
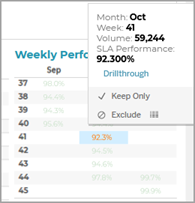
You simply click again to clear the filter. To clear a multiple selection, click multiple times. You can also select Undo/Redo to clear a filter.
Note
For the Keep Only and Exclude options that are displayed when you hover over the filter, refer to the Keep Only/Exclude switch.
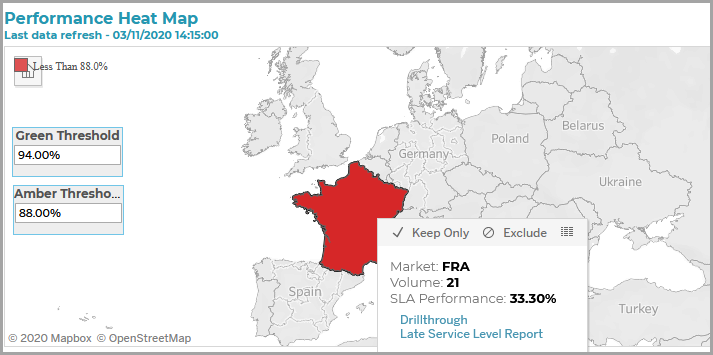
To drill through to the parcel-level detail from the heat map, you first need to select the country from the map and then hover over it until a pop-up menu appears. This contains two hyperlinks: Drillthrough (which takes you to the Late Parcels tab) and Late Service Level Report.
Late Parcels tab
If you click on Drillthrough, the individual parcels are displayed on the Late Parcels tab, e.g.

This allows you to see how late particular parcels were.
Important
Hours Late is measured as the difference between the Actual Delivery Date and the Guaranteed Delivery Date. The First Delivery Attempt is not taken into account.
You can use the Order Numbers and Consignment Codes on the left of the tab to identify the packages in Metapack Delivery Manager.
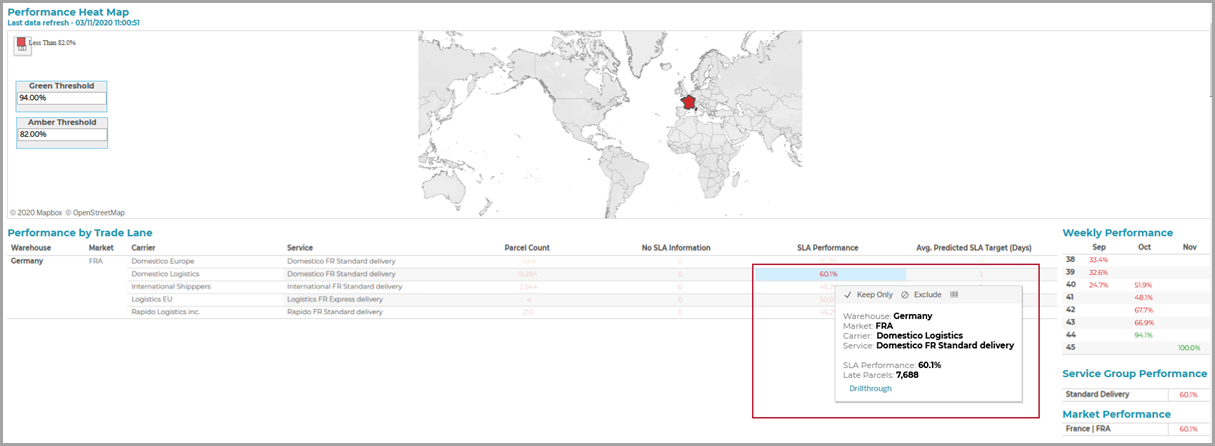
You can also drill through to the packages from any individual cell of the main report table. Select the cell and then hover over it until the Drillthrough link appears, e.g.
Late Service Level Report
You can also click on the Late Service Level Report hyperlink that is displayed when you hover over a country.
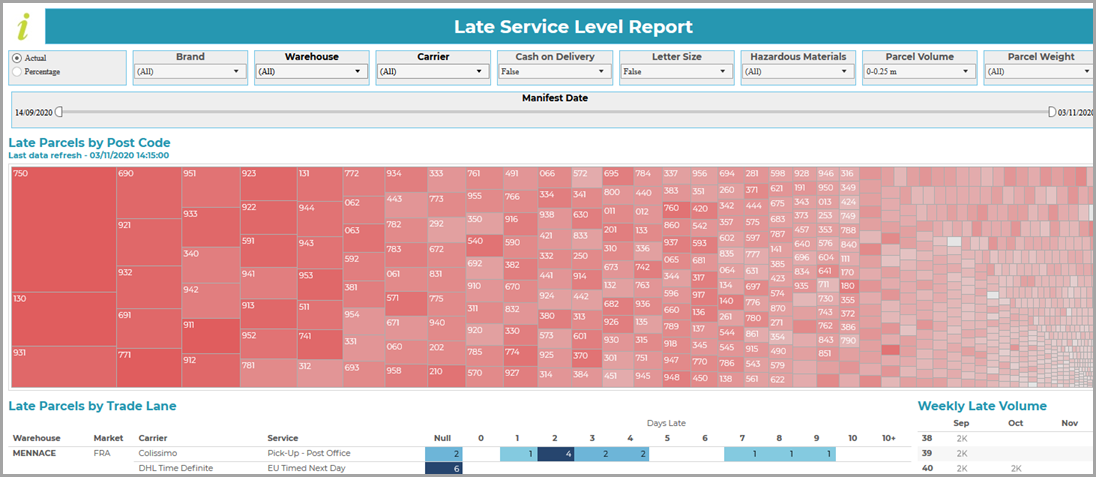
This allows you to view late parcels by postcode (the postcodes are listed in order of number of late parcels from top left to bottom right), and trade lane, e.g.
