The Carrier Review report allows you to view the volumes that carriers delivered to selected trade lanes and markets during the last 50-day rolling period. You can slice the data by carrier, carrier service, parcel status (Delivered, Delayed, etc.) and ISO week.
You can use the report to:
See how a selected carrier performed over specific periods of time while delivering to certain markets.
Visualise where packages are not being delivered on time by particular carriers or carrier services, or are being delivered damaged, etc.
Investigate consumer complaints related to individual packages. Customer Service Operatives do this by drilling through to the Parcel Details tab.
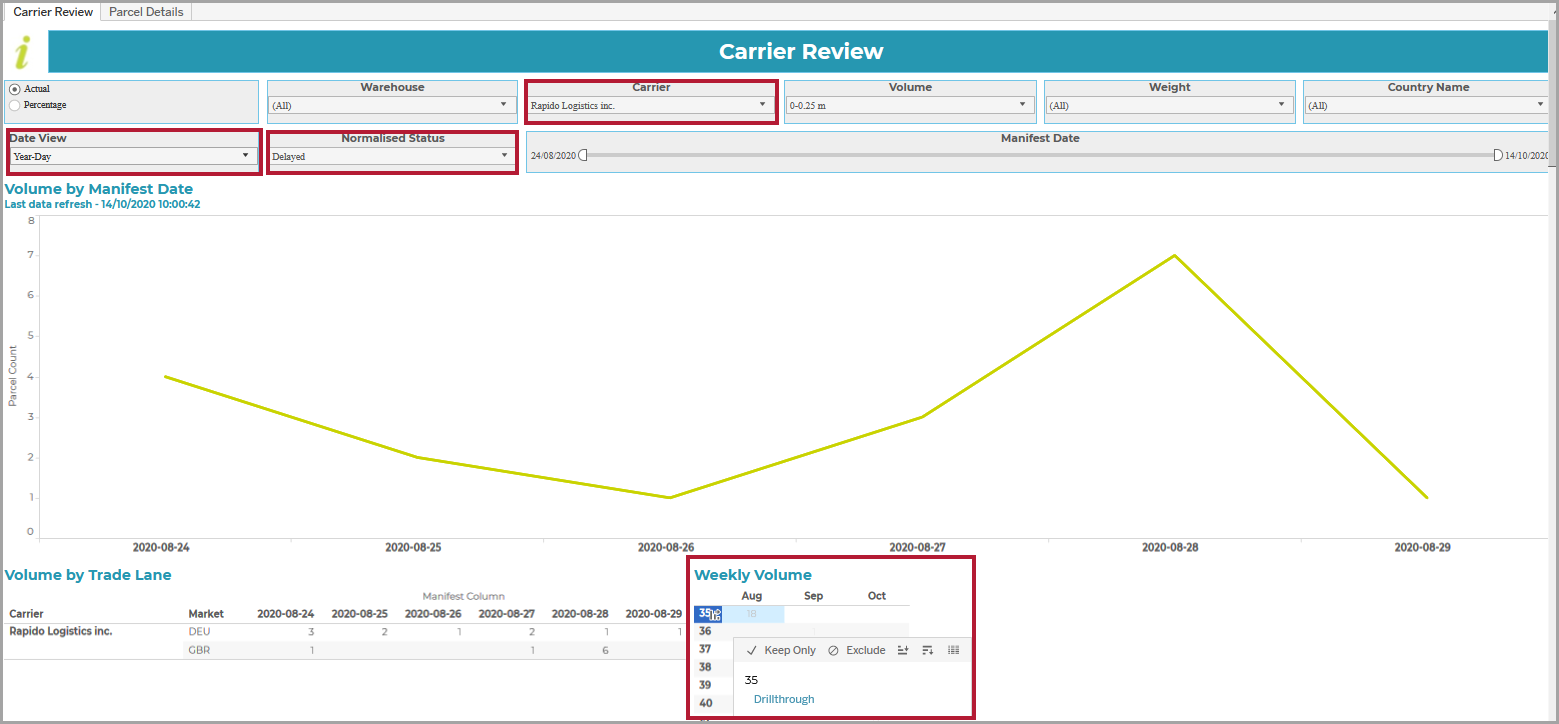
Let us say that you were concerned about the number of packages that a carrier failed to deliver within a particular market. You might select the filters shown in the video below.
The final action is to drill through to the individual packages:
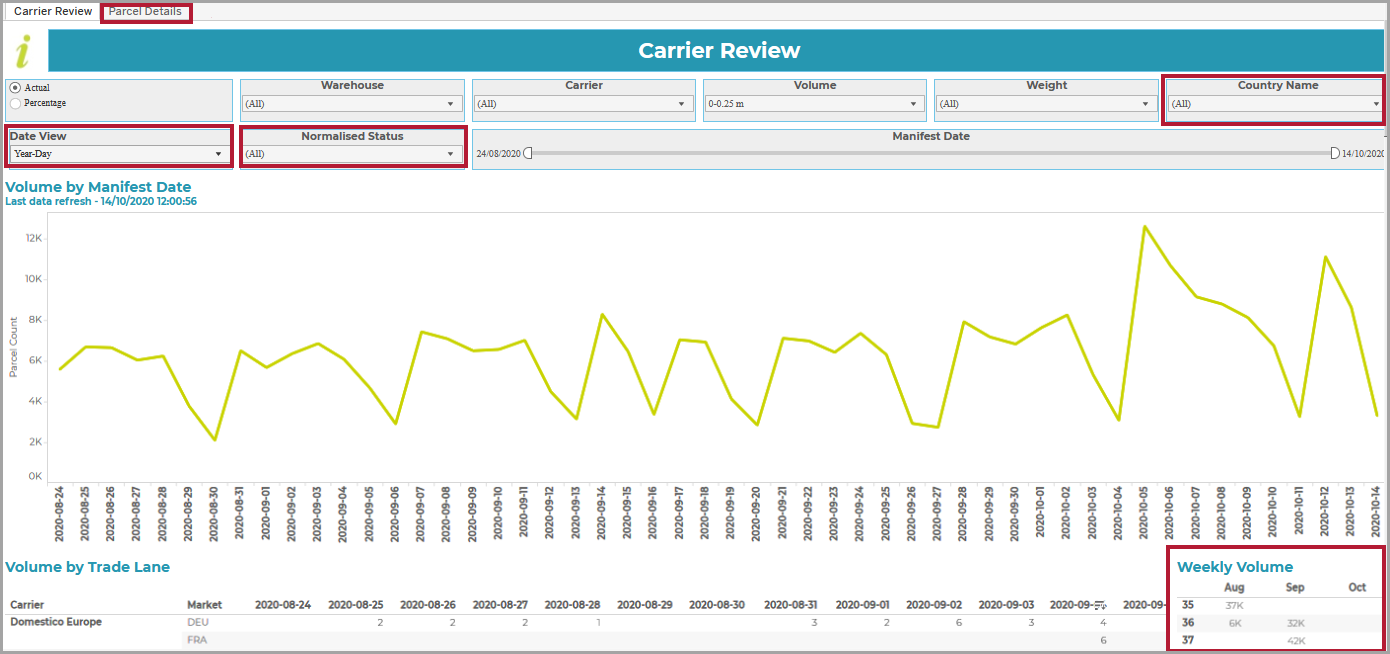
In addition to the global filters previously described, the report provides the filters and switches highlighted in the following screenshot:
Note
For the population of the Parcel Details tab shown at the top of the screen, refer to Drilling through to the Parcel Details tab.
Country Name
This filter allows you to set the country for which content is to be displayed:

All countries in the current dataset are selected by default. To select the one(s) for which you wish to display data, first deselect All (so that (None) appears in the filter). Then select the one(s) required. To select a particular country, type part or all of the name at the top of the filter box (to restrict the display). Then tick it.
Once you click away from the box, the graph, trade lanes and weekly, 'service group' and market 'slicers' are updated automatically in line with your selection.
Date View
The Date View switch allows you to set the time period for the graph:
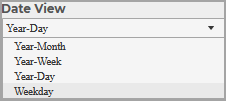
You can switch between showing the data by Year-Day (the default), Year-Month, Year-Week (i.e. by ISO week), or Weekday.
Normalised Status
This filter allows you to set the status(es) for which content is to be displayed;
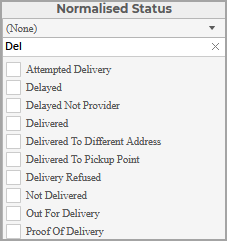
All statuses are selected by default. To select the one(s) for which you wish to display data, first deselect All (so that (None) appears in the filter). Then select the one(s) required. To select a particular status, type part or all of the name at the top of the filter box (to restrict the display). Then tick it.
Weekly Volume
This 'quick filter' allows you to select an individual ISO week for which you wish to show data:
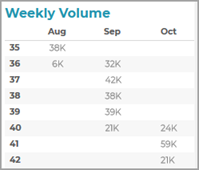
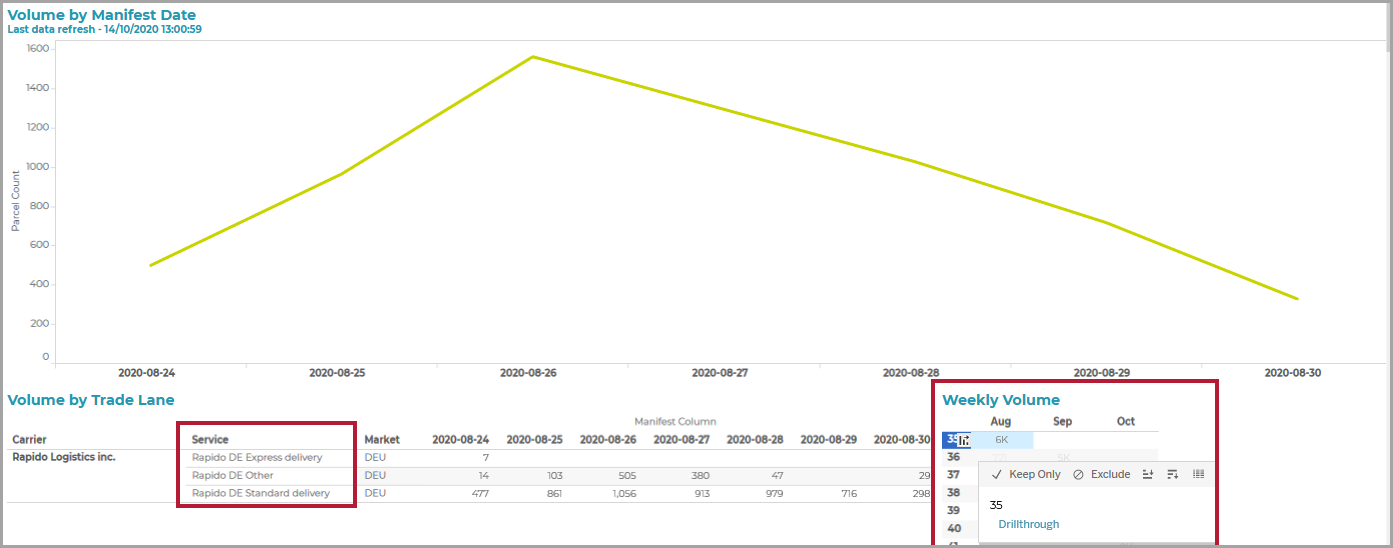
When you click on the week, the report data is filtered to show only the results for the particular week, e.g.
Tip
If you wish to expand the carrier to break the results down by individual carrier service, hover over the carrier and click the + symbol that appears next to it. Click the - symbol to collapse the results back to just the carrier.
You simply click again to clear the filter. To clear a multiple selection, click multiple times. You can also select Undo/Redo to clear a filter.
Note
For the Keep Only and Exclude options that are displayed when you hover over the filter, refer to the Keep Only/Exclude switch.
You will note a Drillthrough link at the bottom of the 'quick filter' when you hover over it. Clicking on this populates the Parcel Details tab with details of the associated parcels so that you can look them up on your Metapack shipping platform.
If you click on Drillthrough in the above example, the delayed parcels are displayed under the Parcel Details tab, e.g.

This view allows you to see why each parcel was delayed, and the extent of the delay in each case.
You can use the Order Numbers and Consignment Codes on the left of the tab to identify the packages in Metapack Delivery Manager.
You can also drill through to the packages from any individual cell of the main report table. Select the cell and then hover over it until the Drillthrough link appears, e.g.

This allows you, for example, to look at why parcels were delayed on a particular day:

