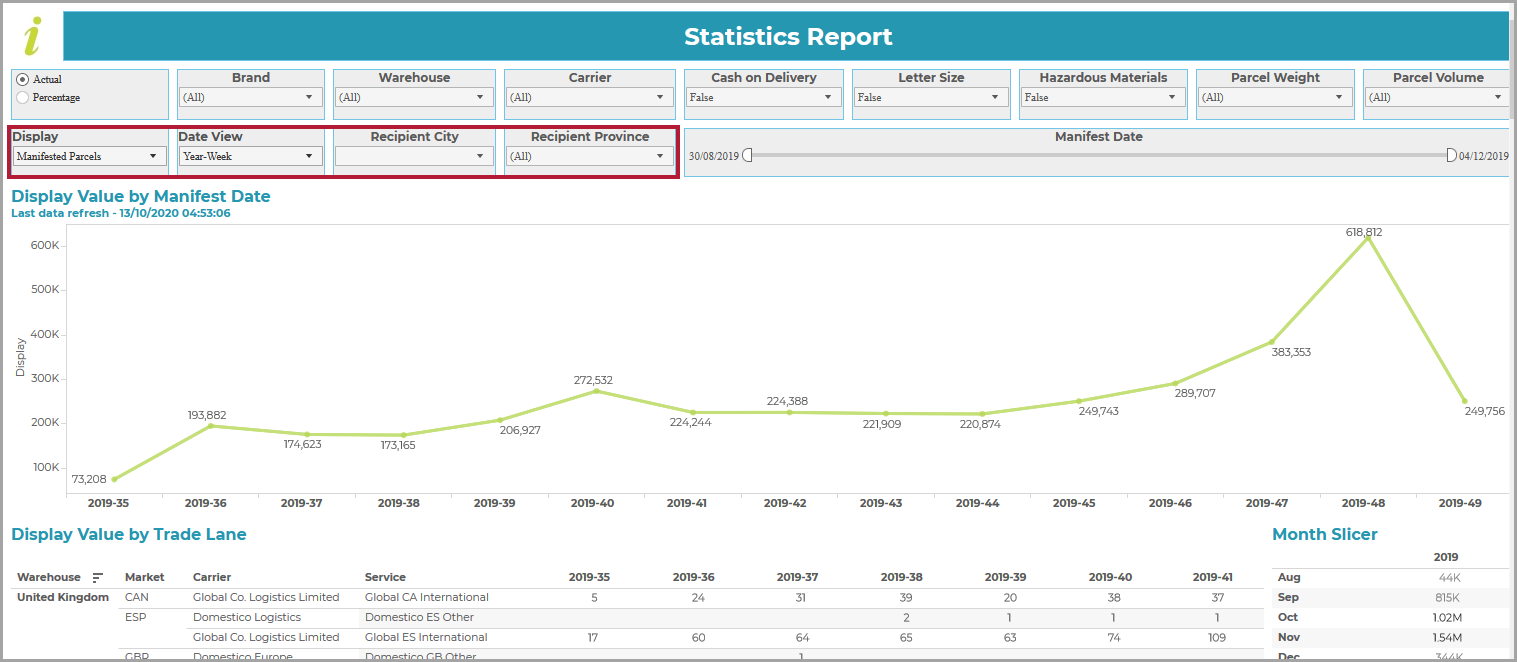
The Statistics Report provides a line graph of your shipping profile using the aggregated parcel counts (for up to 3 years from the date of manifesting).
The report facilitates the detection of trends in shipping patterns, carrier performance and traffic flow. For example, you can use the report to:
Determine the average weight and size of parcel shipped to a trade lane during different periods. This information may then be used to go to tender or negotiate pricing for services based on typical shipping profiles.
Compare the results over named weekdays, months, and years, to identify growth trends and patterns in despatch volumes.
-
Use the trends and patterns in shipping volumes to:
plan internal resources for peak and trough periods;
identify when to introduce additional shipping services;
generate external forecasts for use in the negotiation of carrier contracts.
Let us say that you wanted to go out to tender for services to Ireland from the UK warehouse, and needed to add to the RFP the average volume of parcels going to the Irish market during Black Friday week.
This video shows you how to select the above criteria:
In addition to the global filters previously described, the report provides the filters and switches highlighted in the following screenshot:

Note
The Recipient City and Recipient Province filters are not currently available.
Display Type
The Display switch allows you to change the type of content displayed in the graph:

You can switch the display between the absolute package counts (the Manifested Parcels default), the Weight of the parcels in kg, or their Cubic Volume (i.e. volume in cubic metres).
Date View
The Date View switch allows you to set the time period for the graph:

You can switch between showing the package counts/weights/volumes by ISO week (the Year-Week default), and showing them by Year, Year-Month, Year-Day or Weekday.
