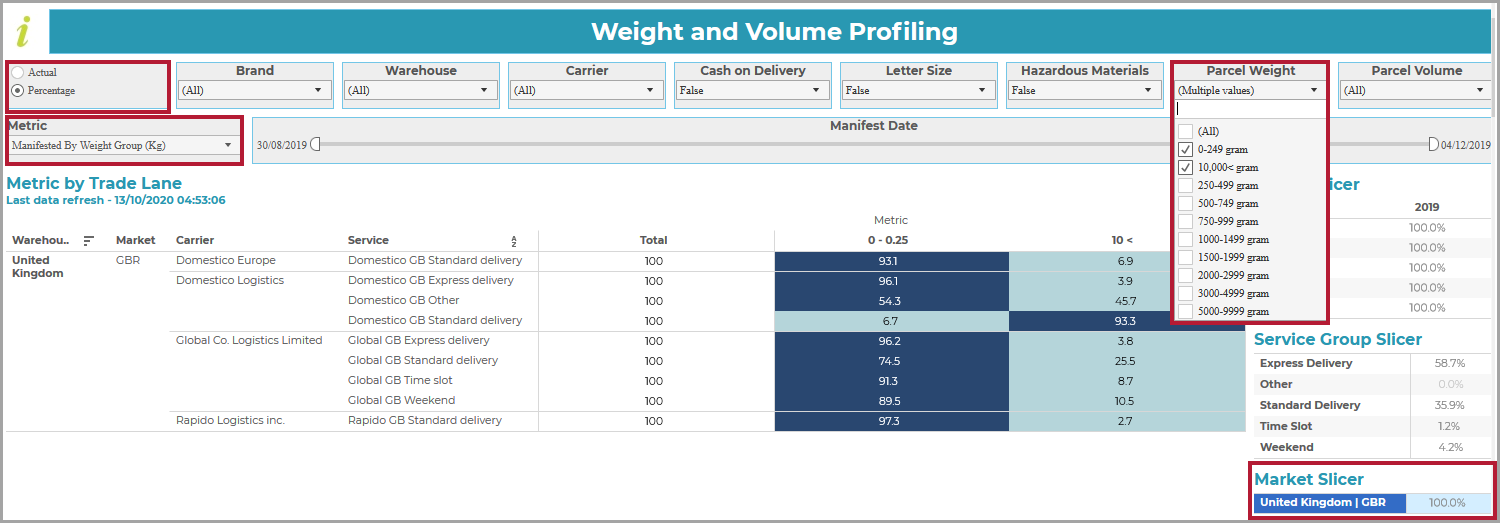
The following is an example of a report showing which percentage of manifested parcels sent within the UK were in the lower 0-249 gram band:

The report highlights that large volumes of small packages that could be sent more cheaply by mail carriers, are currently being handled by courier services.
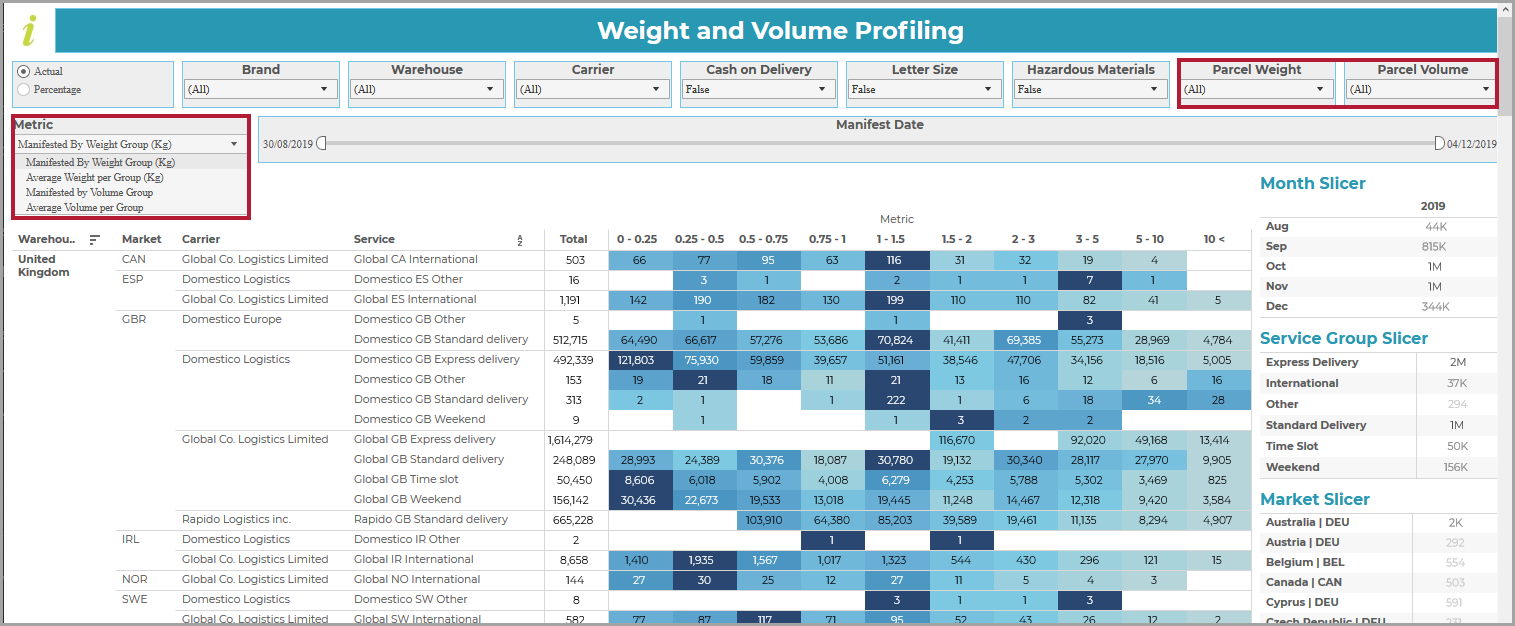
In addition to the global filters previously described, the report provides the following Metric switch in the left hand corner of the page:

It allows you to select whether to display data by Weight Group or Volume Group and whether Average or Manifested values are to be shown. The options work in conjunction with the bands within the Parcel Weight and Parcel Volume filters.
The columns in the resultant report reflect the Metric switch setting, moving between:
Manifested by Weight Group (Kg) – the rows show the number of packages despatched within each of the weight bands specified using the Parcel Weight filter.
Average weight per group (Kg) – the rows show the average mean weight (in Kg) of the packages in the current dataset within each of the weight bands specified using the Parcel Weight filter.
Manifested by Volume Group – the rows show the number of packages despatched within each of the volume bands specified using the Parcel Volume filter.
Average Volume per Group – the rows show the average volume (in cubic metres) of the packages in the current dataset within each of the volume bands specified using the Parcel Volume filter.
The Weight and Volume Profiling report provides a line graph of your package profile using the aggregated parcel counts (for up to 3 years from the date of manifesting).
The report allows you to see the number of shipments despatched within each weight or volume band, so that you can, for example:
Supply forecasting models and request quotations for service from new carriers.
Check which courier services are handling large volumes of small packages that could be sent more cheaply by mail carriers.